English
  Русский
 Bahasa Indonesia
 Bahasa Malay
 ไทย
ไทย Español
 Deutsch
 Български
 Français
 Tiếng Việt
 中文
中文 বাংলা
বাংলা हिन्दी
 Čeština
 Українська
 Română

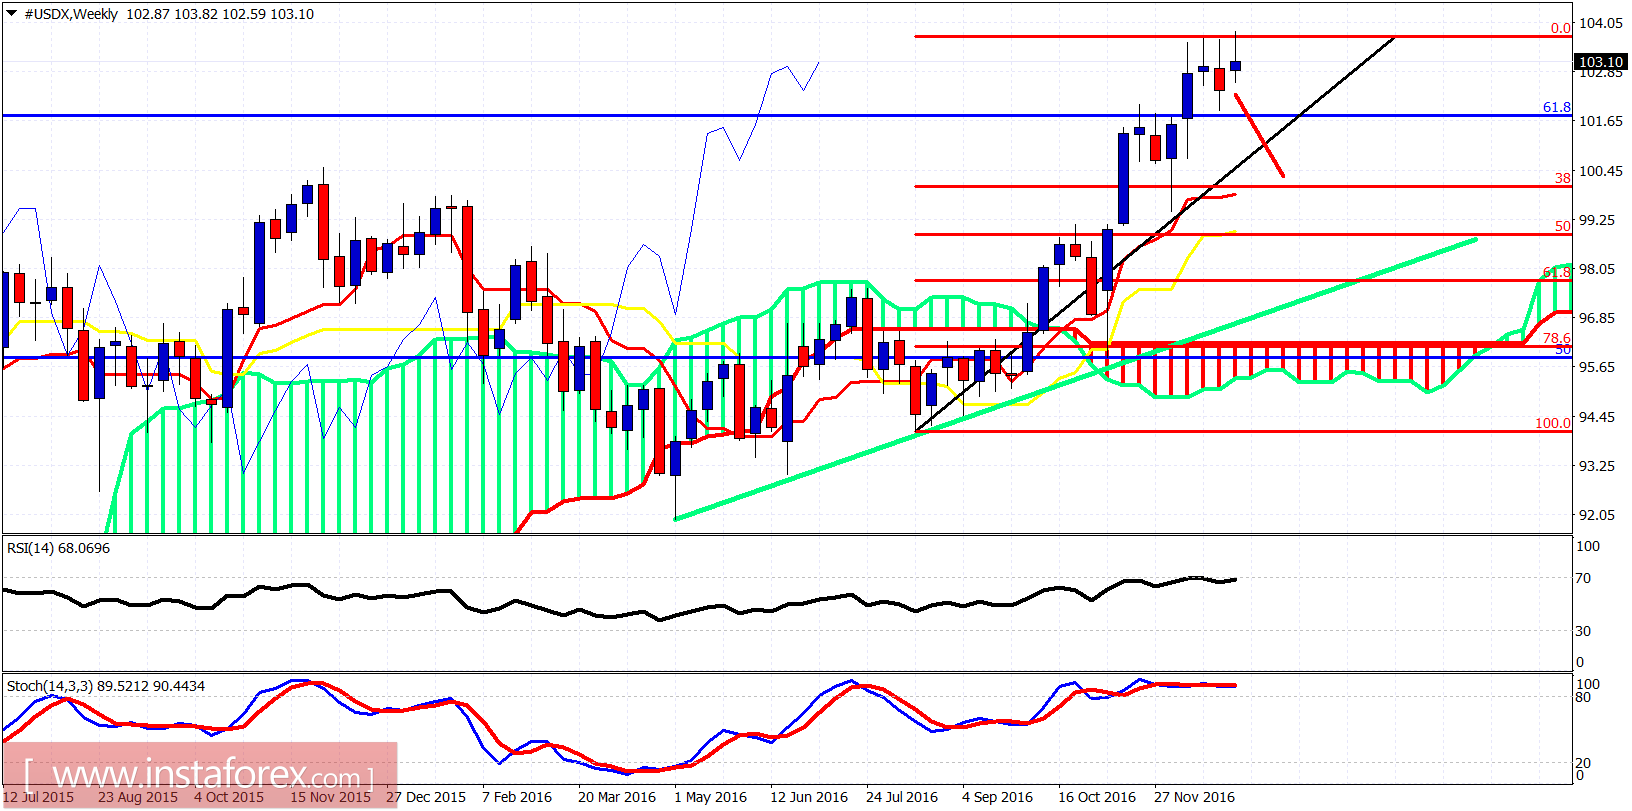
The Dollar index made a new high but it was not confirmed by the RSI. The divergence pattern in RSI during the new highs is worrying for bulls specially if price breaks below 102.20. There are a lot of chances we saw a fake breakout and rejection.
Blue line - resistance
Green line - support
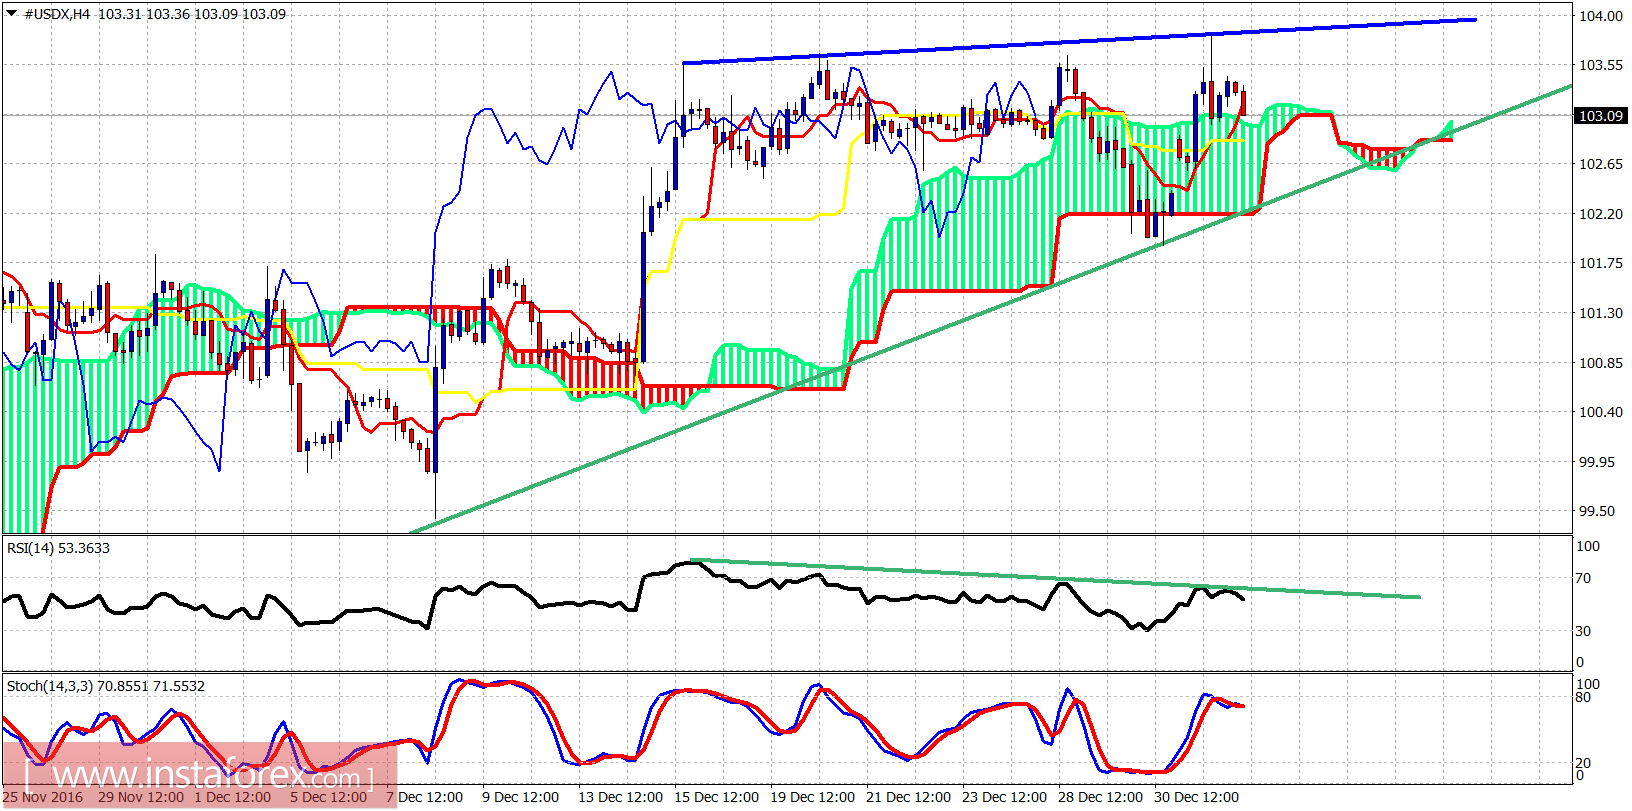
The RSI is diverging on the 4 hour chart. A break below short-term support of 102.20 will give a new stronger sell signal that will at least push prices towards the next important support at 100. So bulls should be very cautious if price breaks below the 4-hour cloud and the green trend line support.