 English
  Русский
 Bahasa Indonesia
 Bahasa Malay
 ไทย
ไทย Español
 Deutsch
 Български
 Français
 Tiếng Việt
 中文
中文 বাংলা
বাংলা हिन्दी
 Čeština
 Українська
 Română

The Dollar index has broken short-term support and is pulling back as expected. Dollar bulls were warned that the signs were there for a strong pullback in the Dollar index and it was time to protect their longs.
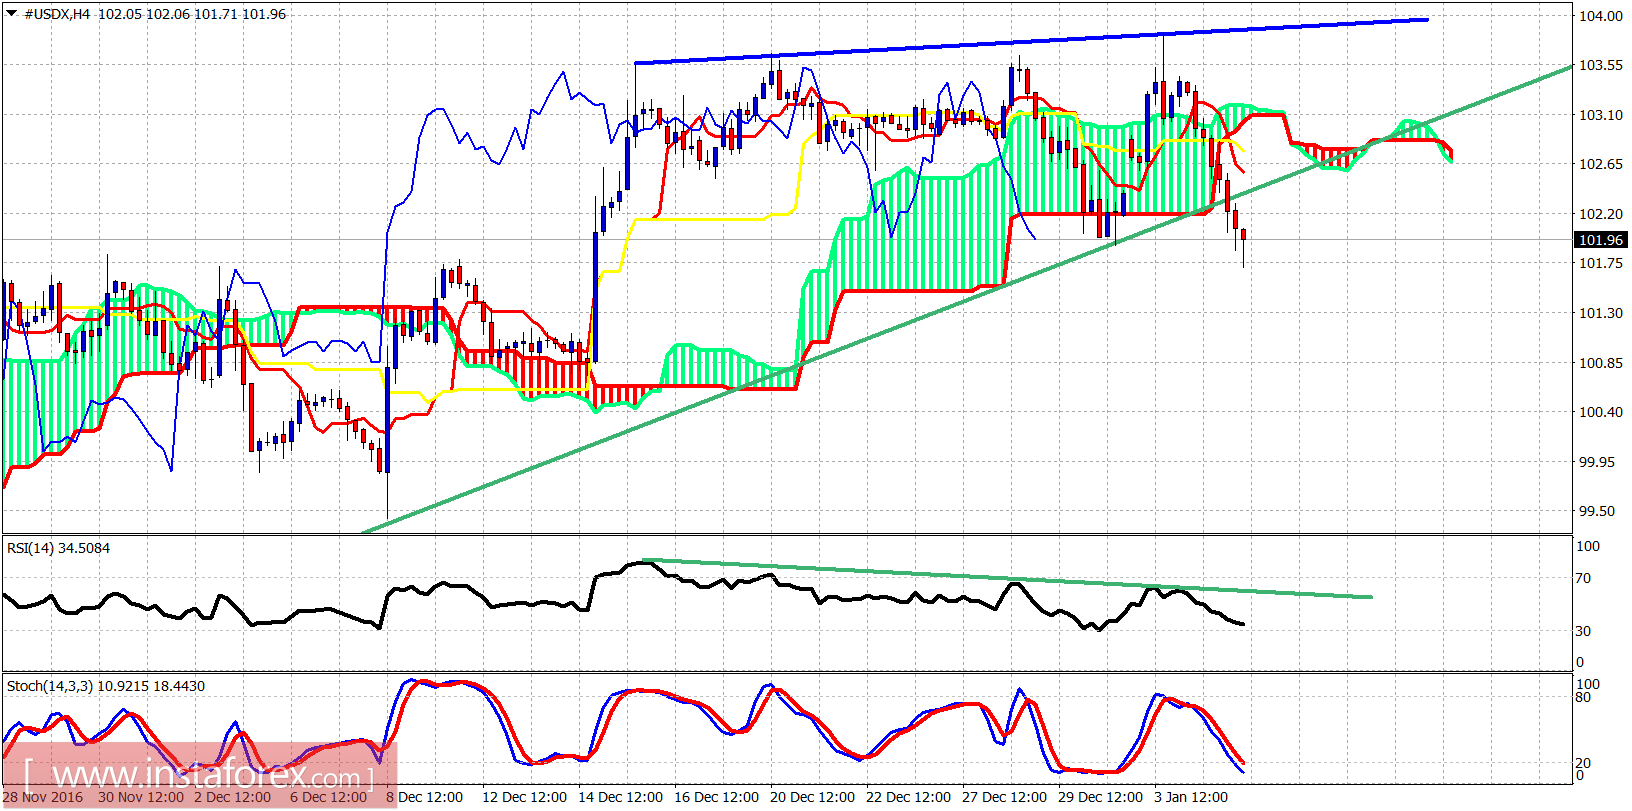
Green line - support
The Dollar index has broken through the green trend line support and is trading below the Ichimoku cloud on the 4-hour chart. The bearish divergence in the RSI was a warning I gave in my previous few posts and is now playing out. A backtest of the breakdown could be seen today with a bounce towards 102.40.
