 English
  Русский
 Bahasa Indonesia
 Bahasa Malay
 ไทย
ไทย Español
 Deutsch
 Български
 Français
 Tiếng Việt
 中文
中文 বাংলা
বাংলা हिन्दी
 Čeština
 Українська
 Română

The pair skyrocketed during Thursday's session above the 1.2400 psychological level and it's heading to test the resistance zone of 1.2454. That scenario is likely to happen in the short term, as GBP/USD already made a new higher high across the board. If the Cable manages to break it, then the next target to the upside is located at the 1.2516 level.
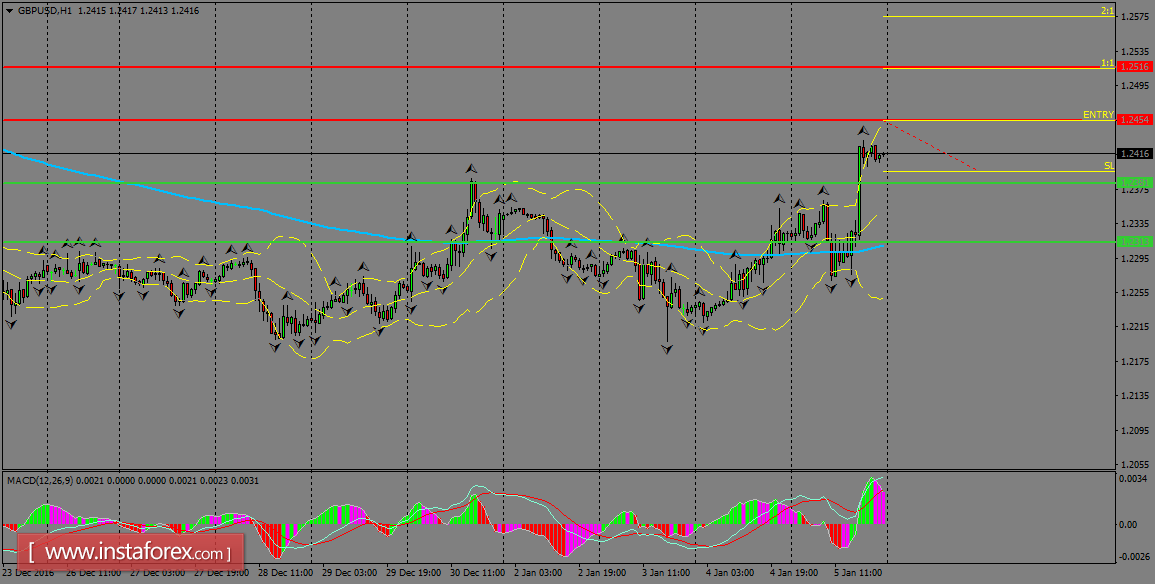
H1 chart's resistance levels: 1.2454 / 1.2516
H1 chart's support levels: 1.2381 / 1.2313
Trading recommendations for today: Based on the H1 chart, buy (long) orders only if the GBP/USD pair breaks a bullish candlestick; the resistance level is at 1.2454, take profit is at 1.2516 and stop loss is at 1.2395.