 English
  Русский
 Bahasa Indonesia
 Bahasa Malay
 ไทย
ไทย Español
 Deutsch
 Български
 Français
 Tiếng Việt
 中文
中文 বাংলা
বাংলা हिन्दी
 Čeština
 Українська
 Română

The index once again posted another bearish session during Thursday, as the support level of 101.39 is about to be broken in coming hours. If that happens, we can expect a bearish continuation towards the 100.79 zone and the current location of the 200 SMA on H1 chart is supporting that idea. However, if USDX makes a rebound at current levels, we can expect a slight rebound towards 101.79.
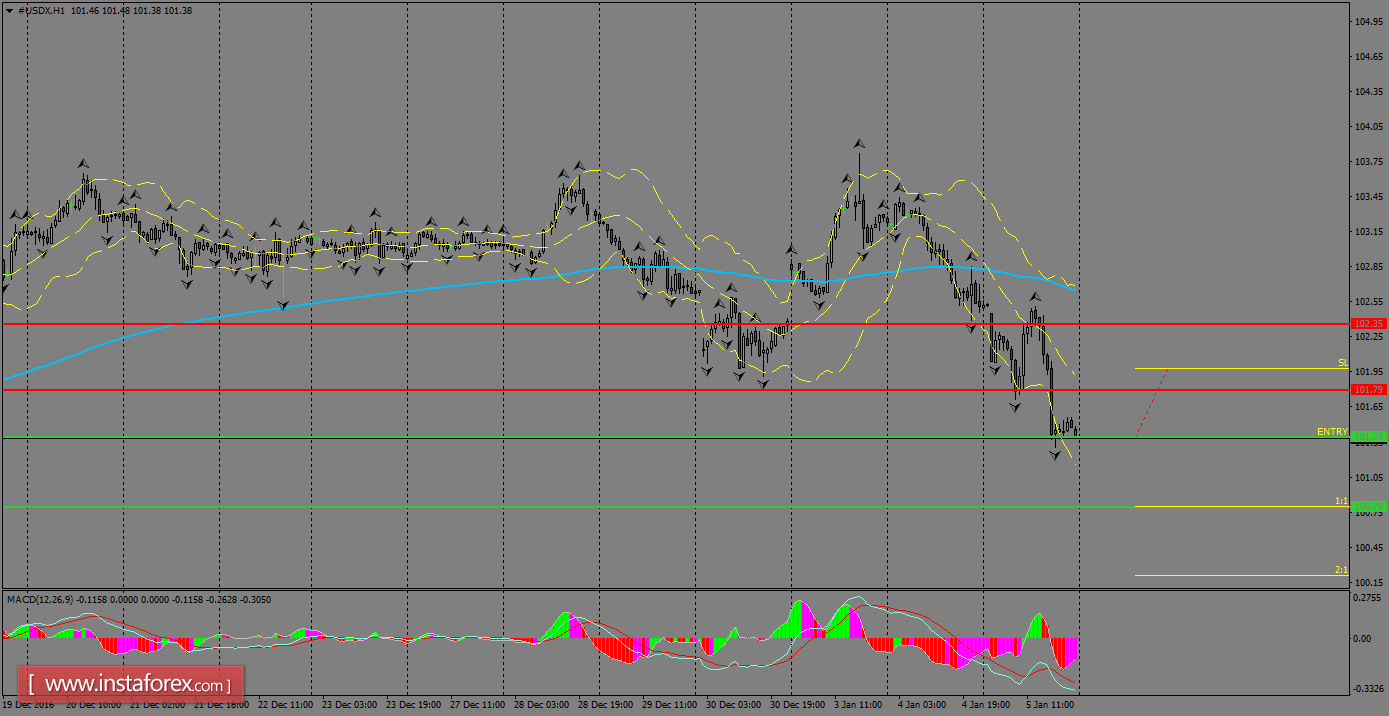
H1 chart's resistance levels: 101.79 / 102.35
H1 chart's support levels: 101.39 / 100.79
Trading recommendations for today: Based on the H1 chart, place sell (short) orders only if the USD Index breaks with a bearish candlestick; the support level is at 101.39, take profit is at 100.79 and stop loss is at 101.97.