 English
  Русский
 Bahasa Indonesia
 Bahasa Malay
 ไทย
ไทย Español
 Deutsch
 Български
 Français
 Tiếng Việt
 中文
中文 বাংলা
বাংলা हिन्दी
 Čeština
 Українська
 Română

Friday was very volatile for USD-related pairs and in the case of the Sterling, GBP/USD weakened across the board to consolidate below the 200 SMA at H1 chart. The next target to the downside is located around 1.2226, where a demand zone is placed and it could help to bring some bulls force to push higher the pair. If GBP/USD gets back to the previous trend, it should break the resistance level of 1.2306 to reach the area of 1.2385.
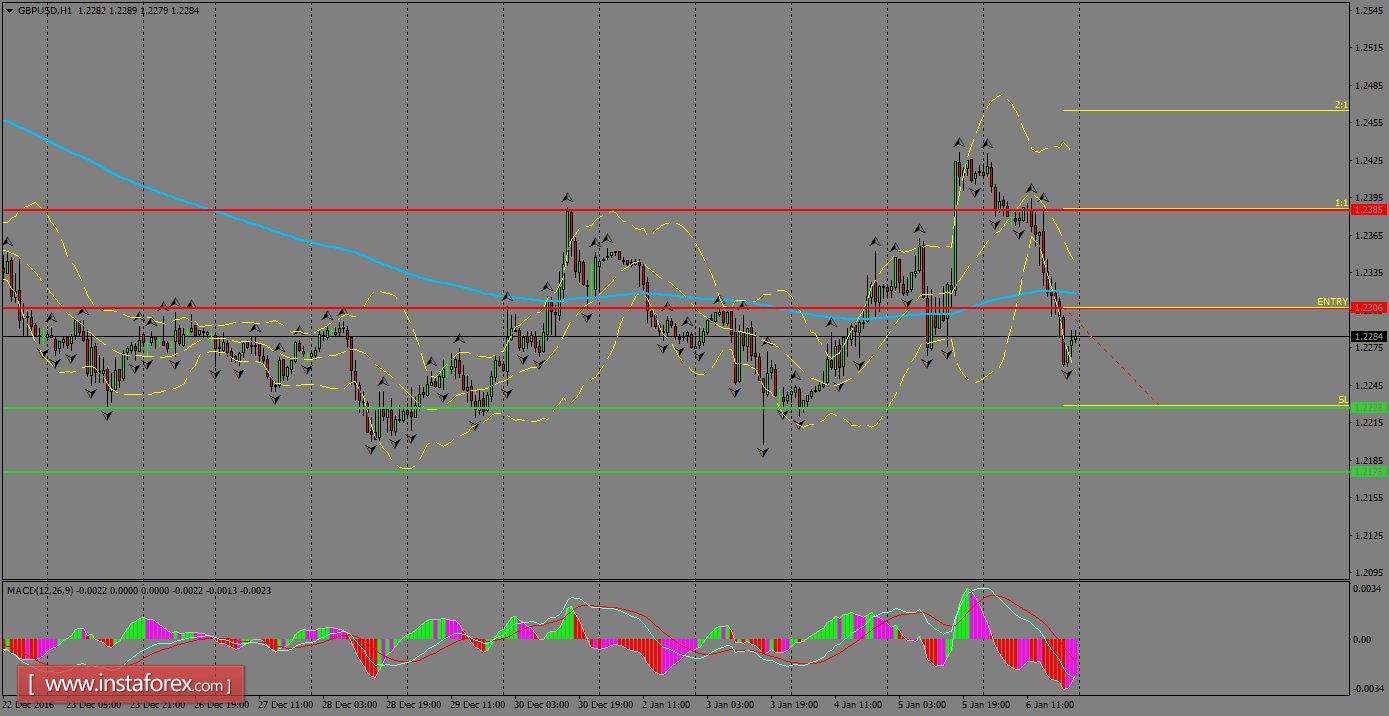
H1 chart's resistance levels: 1.2306 / 1.2385
H1 chart's support levels: 1.2226 / 1.2176
Trading recommendations for today: Based on the H1 chart, buy (long) orders only if the GBP/USD pair breaks a bullish candlestick; the resistance level is at 1.2306, take profit is at 1.2385 and stop loss is at 1.2228.