 English
  Русский
 Bahasa Indonesia
 Bahasa Malay
 ไทย
ไทย Español
 Deutsch
 Български
 Français
 Tiếng Việt
 中文
中文 বাংলা
বাংলা हिन्दी
 Čeština
 Українська
 Română

Gold price remains near its highs after making a higher high yesterday at $1,187. However in the short-term a pullback is justified towards $1,150-60 as there are bearish divergence signs on the 4-hour chart.
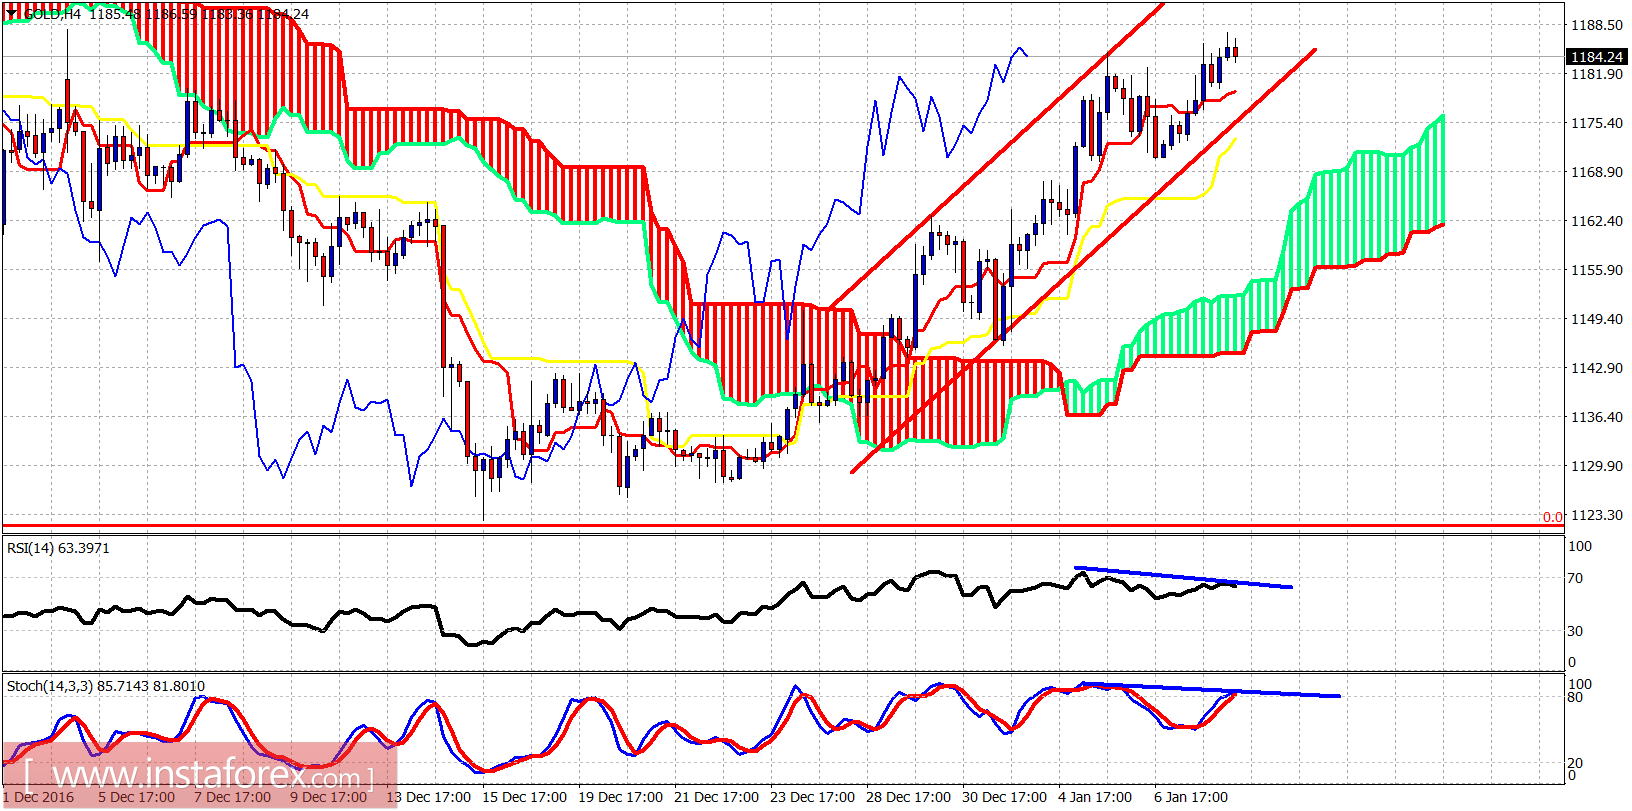
Gold price is trading inside a short-term bullish channel above the 4-hour Ichimoku cloud support. Short-term support is at $1,175. If that level is broken we will assume that the pullback has started with most probable target the $1,160-50 area. Gold price could rebound towards the Ichimoku cloud for a backtest.
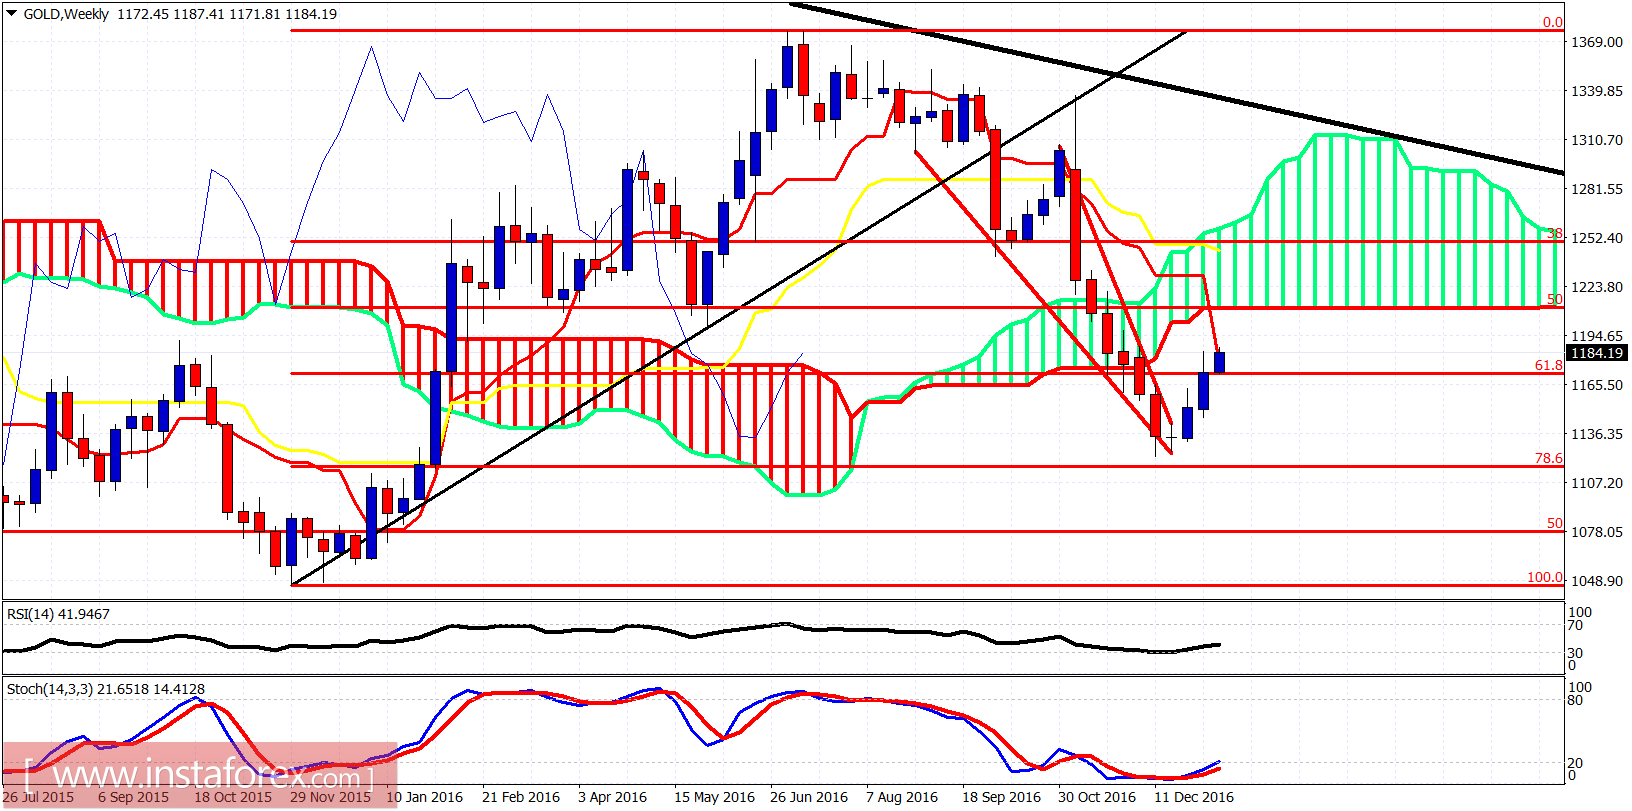
the odds are in favor of the bullish scenario for the Gold price. The chances of a new low will weaken once Gold price breaks above $1,220.