 English
  Русский
 Bahasa Indonesia
 Bahasa Malay
 ไทย
ไทย Español
 Deutsch
 Български
 Français
 Tiếng Việt
 中文
中文 বাংলা
বাংলা हिन्दी
 Čeština
 Українська
 Română

As expected, the dollar index got rejected at resistance and is back near its lows made on January 4th. The reversal in the index is of a bigger degree than normal and I expect further decline in the next few days. However the 102.50 mark is a key level now.
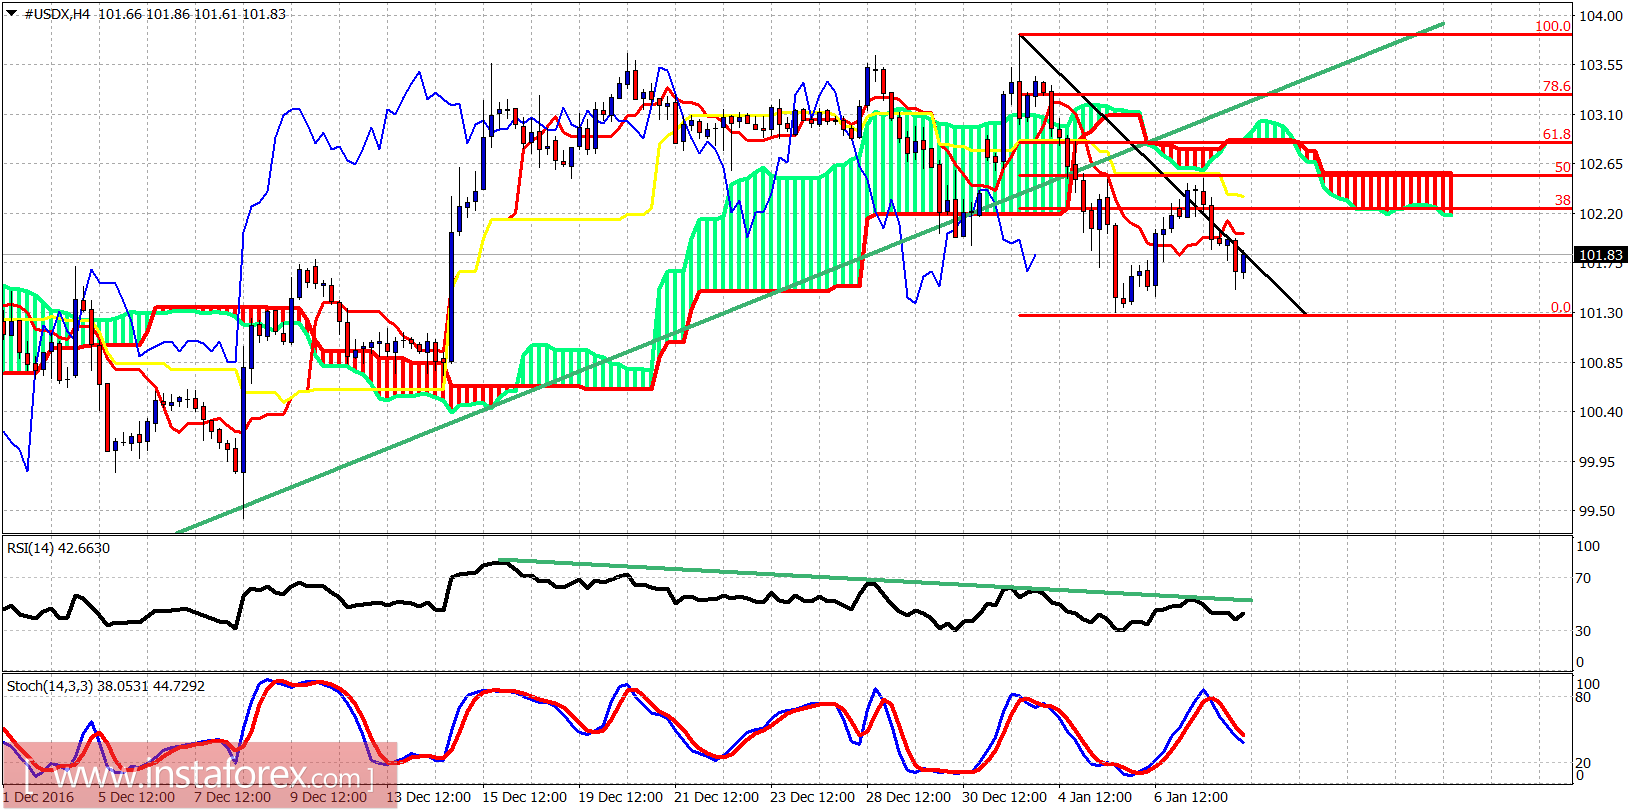
The dollar index broke below the green trend line which was an important short-term support. Price bounced to back test the breakout area and got rejected by the Ichimoku cloud and the 50% Fibonacci retracement. Short-term resistance is now at 102.50 and bulls need to break it in order to see new highs near 104.50-105.
Green line - long-term support
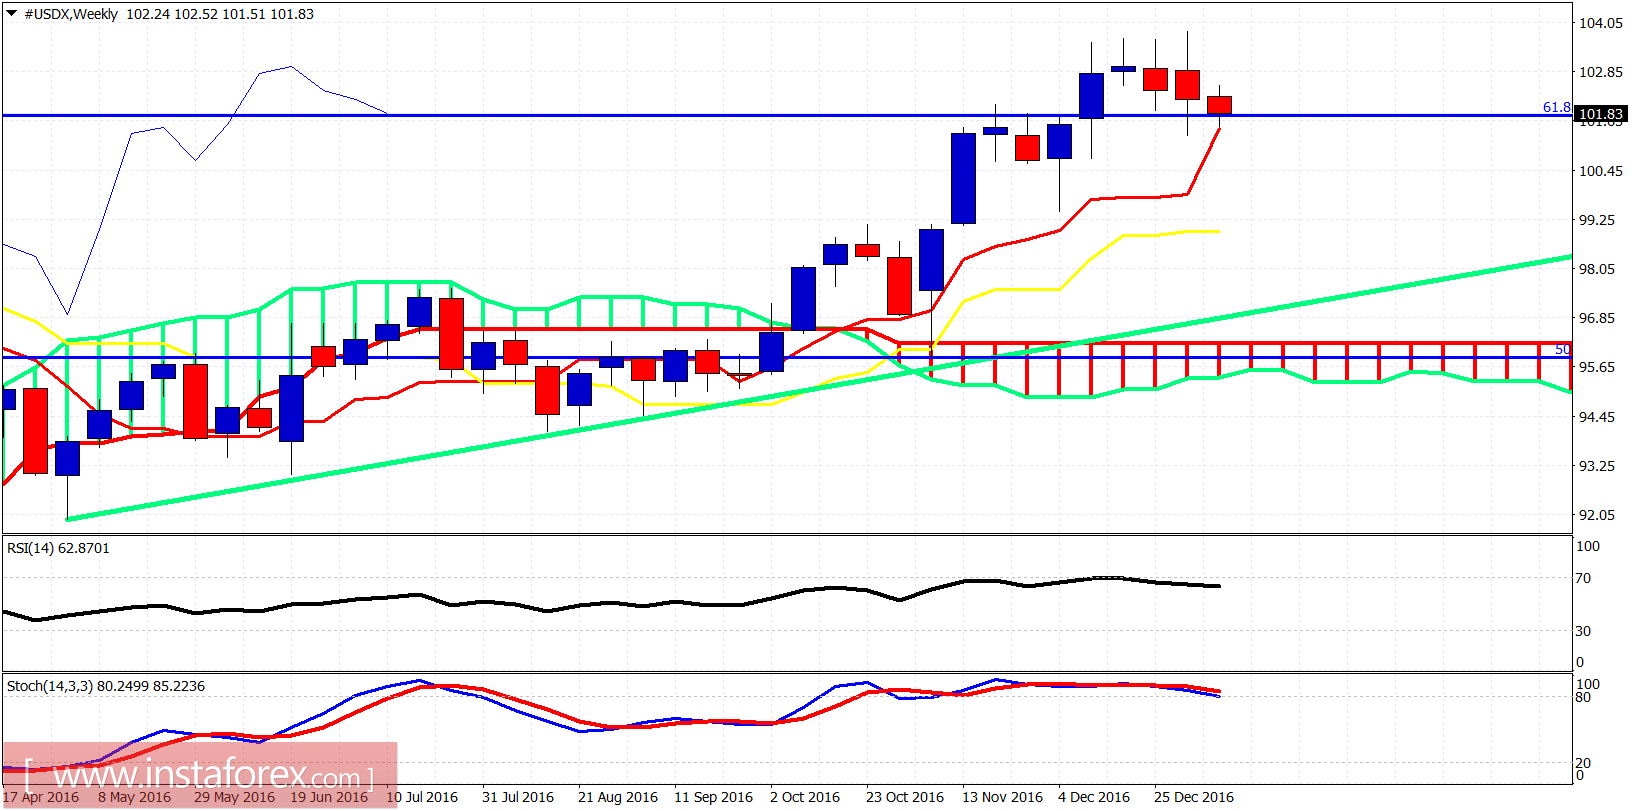
The weekly candle is weakening and has broken the first important support of 102.16 which I mentioned yesterday. Next important support is at 101.28. If we break below it, we should expect a sharp move lower towards 99. Oscillators were warning for a pullback over the past few weeks and I believe the uptrend is unfolding and an important correction has started.