 English
  Русский
 Bahasa Indonesia
 Bahasa Malay
 ไทย
ไทย Español
 Deutsch
 Български
 Français
 Tiếng Việt
 中文
中文 বাংলা
বাংলা हिन्दी
 Čeština
 Українська
 Română

GBP/USD remains supported by the 1.2123 level across the board, as the Sterling continues to show weakness in the short-term. The price is already well consolidated below the 200 SMA at H1 chart and that should deliver more downside toward 1.2033 after the pair manages to break that support mentioned above. MACD indicator is favoring a recovery scenario.
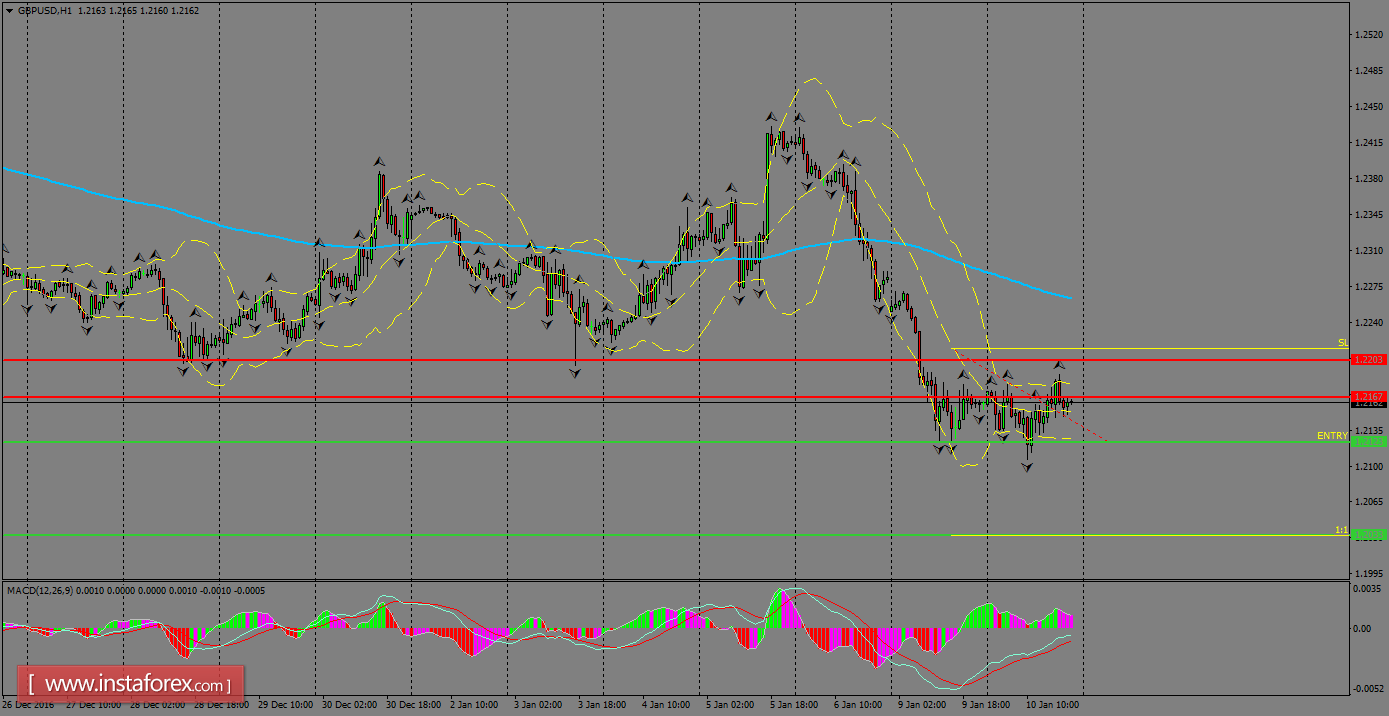
H1 chart's resistance levels: 1.2167 / 1.2203
H1 chart's support levels: 1.2123 / 1.2033
Trading recommendations for today: Based on the H1 chart, sell (short) orders only if the GBP/USD pair breaks a bearish candlestick; the support level is at 1.2123, take profit is at 1.2033 and stop loss is at 1.2214.