 English
  Русский
 Bahasa Indonesia
 Bahasa Malay
 ไทย
ไทย Español
 Deutsch
 Български
 Français
 Tiếng Việt
 中文
中文 বাংলা
বাংলা हिन्दी
 Čeština
 Українська
 Română

USDX is still looking to recover from recent losses and it's likely that we could see a spike toward the 200 SMA at H1 chart around 102.30. If the index manages to break above that area, it's expected to see a rally to test the resistance level of 102.81. However, if we see a pullback at the current stage, we could expect further downside toward 101.39.
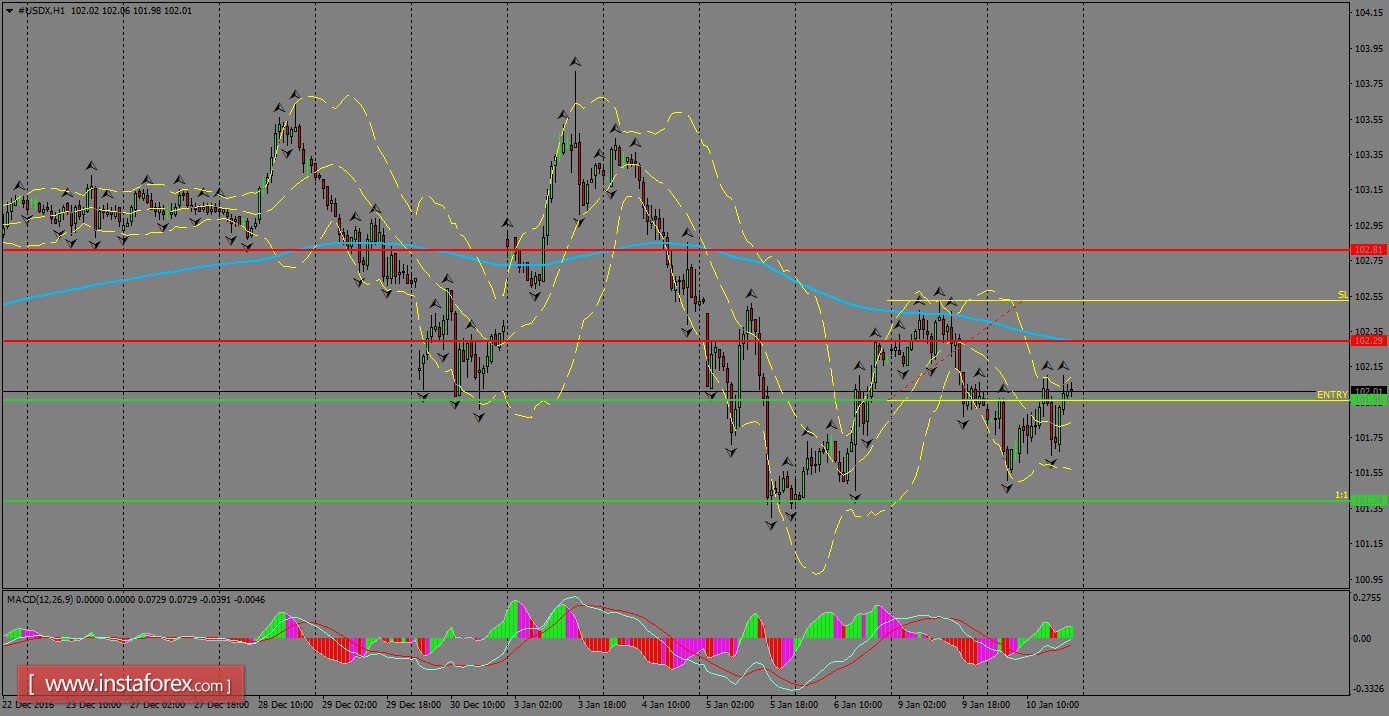
H1 chart's resistance levels: 102.29 / 102.81
H1 chart's support levels: 101.96 / 101.39
Trading recommendations for today: Based on the H1 chart, place sell (short) orders only if the USD Index breaks with a bearish candlestick; the support level is at 101.96, take profit is at 101.39 and stop loss is at 102.54.