English
  Русский
 Bahasa Indonesia
 Bahasa Malay
 ไทย
ไทย Español
 Deutsch
 Български
 Français
 Tiếng Việt
 中文
中文 বাংলা
বাংলা हिन्दी
 Čeština
 Українська
 Română

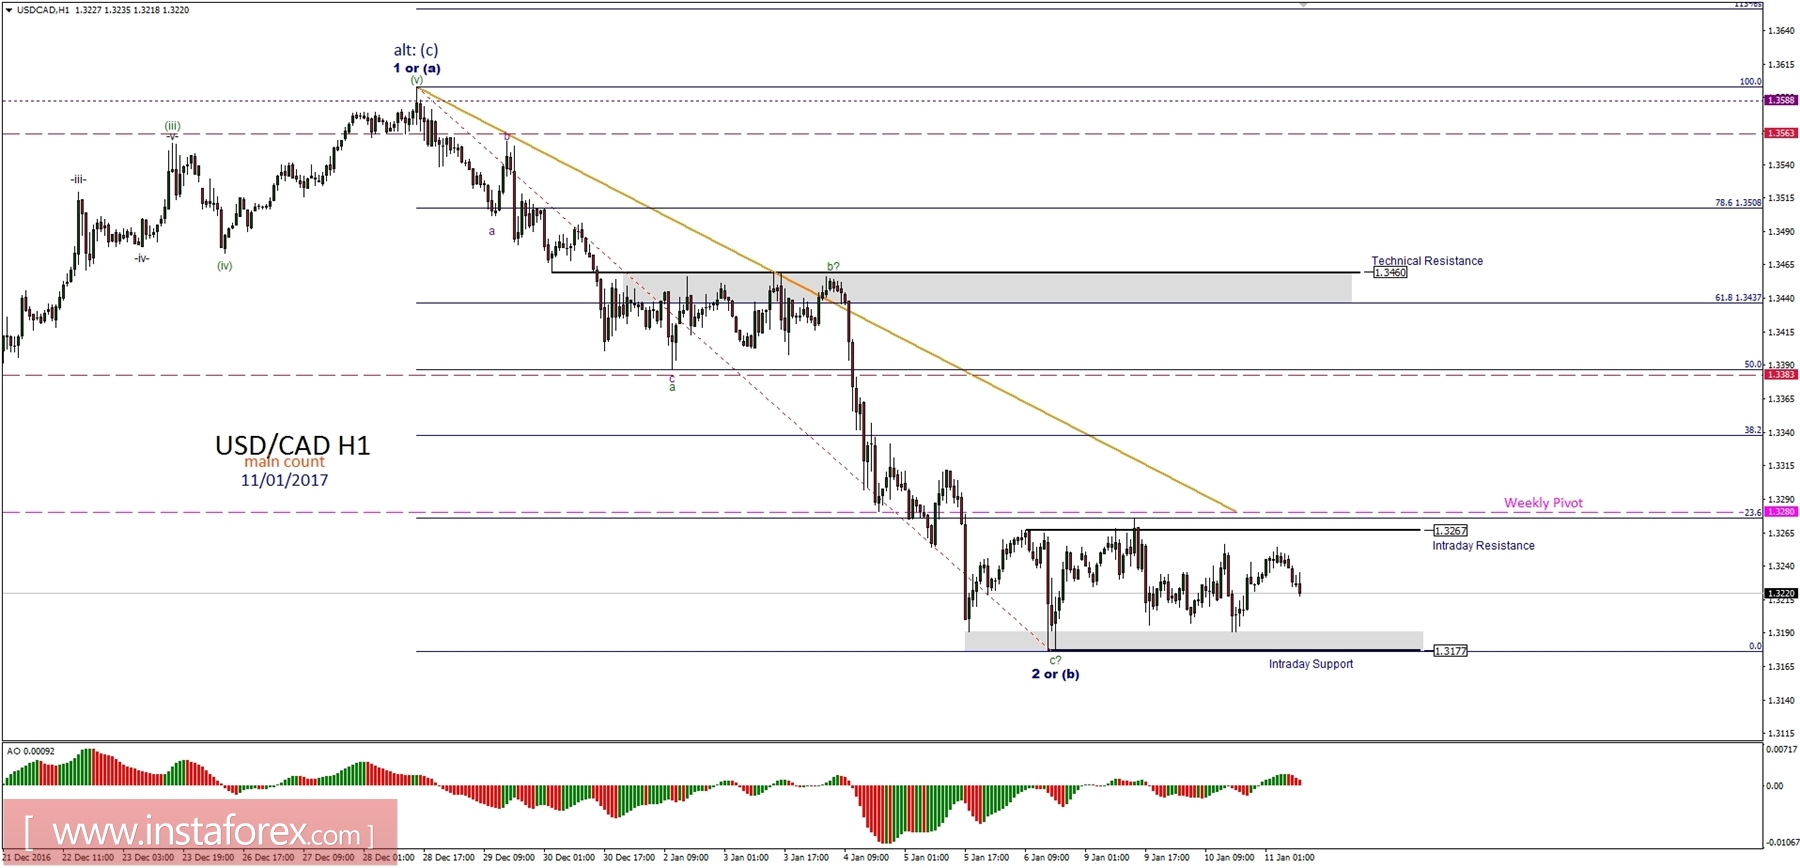
General overview for 11/01/2017:
The sideways trending market is now more evident as no breakout was attempted since Friday last week. The growing bullish divergence between the price and momentum oscillator indicates a stronger bounce towards the 50%Fibo at the level of 1.3390. Nevertheless, the most important zone for bulls is the gray rectangular area between the levels of 1.3437 - 1.3460. Only a sustained breakout above this zone in the impulsive fashion will confirm the wave 3 is in progress and a new high will be made in this market.
Support/Resistance:
1.3101 - WS1
1.3177 - Intraday Support
1.3266 - Intraday Resistance
1.3280 - Weekly Pivot
1.3383 - WR1
1.3350 - 50%Fibo
1.3437 - 61%Fibo
1.3460 - Technical Resistance
Trading recommendations:
Daytraders should consider opening buy orders only if the level of 1.3266 is clearly violated. If the low for the wave 2 or (b) is in place then the price should target the level of 1.3383.