English
  Русский
 Bahasa Indonesia
 Bahasa Malay
 ไทย
ไทย Español
 Deutsch
 Български
 Français
 Tiếng Việt
 中文
中文 বাংলা
বাংলা हिन्दी
 Čeština
 Українська
 Română

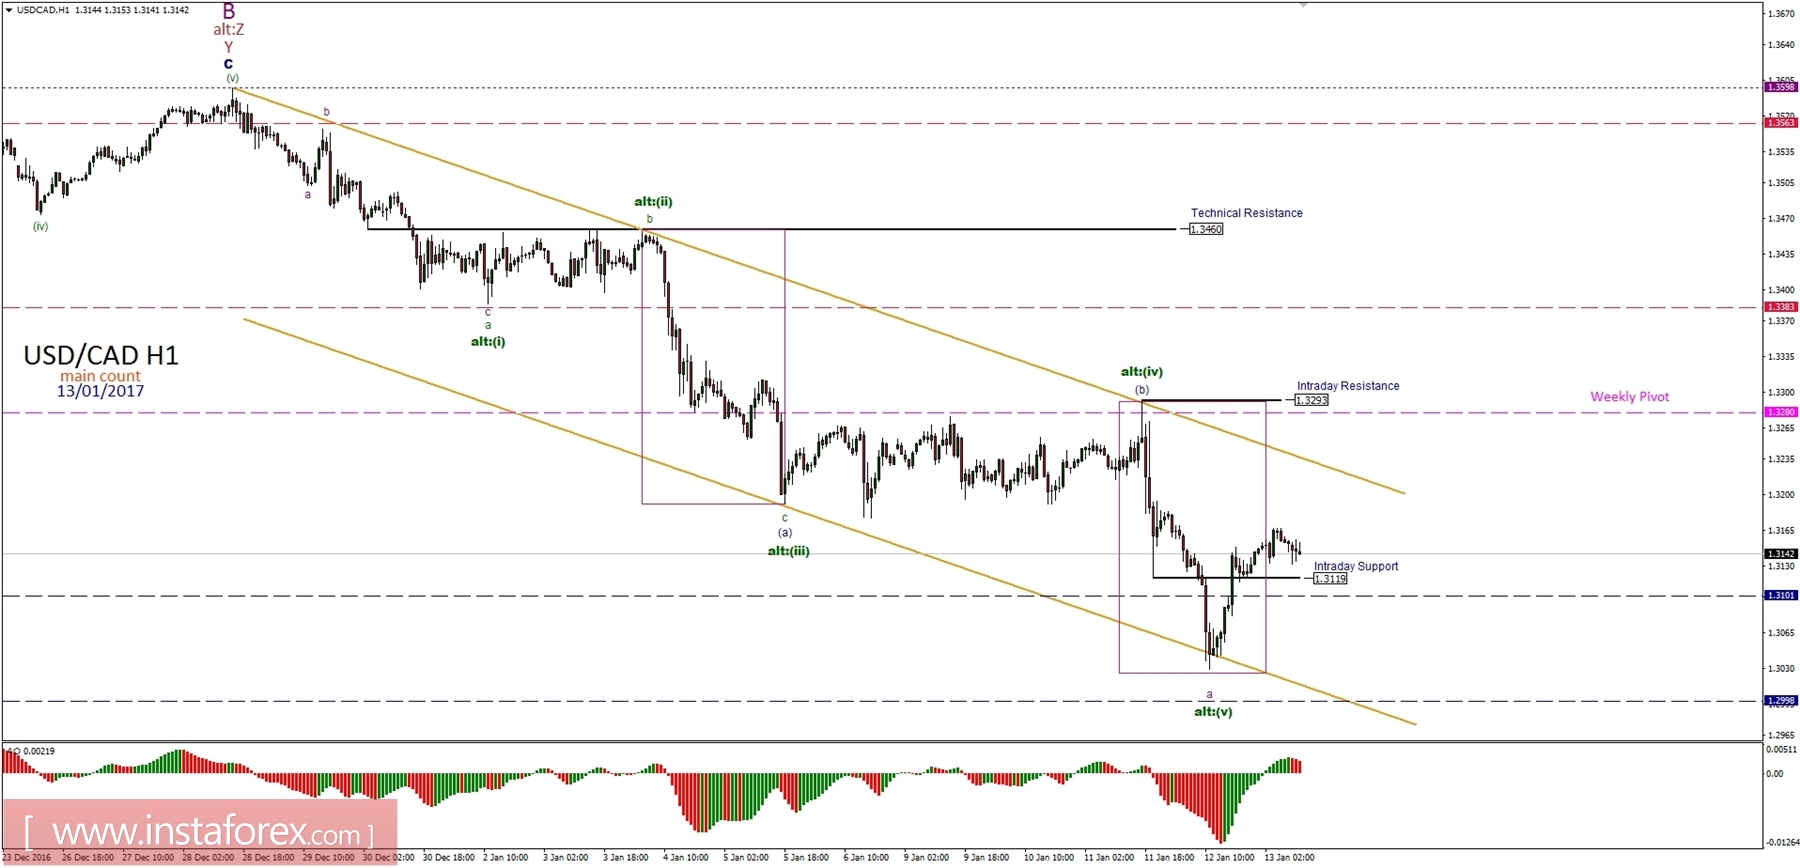
General overview for 13/01/2017:
The market bounced from intraday support at the level of 1.3119, but is still trading inside of the last wave range and below the golden trend line. This corrective rebound might hit the upper arm of the golden trend line but only a sustained breakout above the level of 1.2393 would secure the bottom for wave alt.(v) (green) and extend the correction higher. All of this suggests a deeper decline towards the lows of the wave A (purple) around the level of 1.2460 and an eventual breakout lower. Nevertheless, please notice, this recent leg down might be still just a part of some larger corrective cycle.
Support/Resistance:
1.3600 - Wave B Top
1.3280 - Weekly Pivot
1.3230 - Dashed Purple Channel Support
1.3119 - Intraday Support
1.3026 - Technical Support
Trading recommendations:
Day traders and swing traders should refrain from trading as the market is evolving into a more complex corrective cycle, which is full of whipsaws and false breakouts. Please wait for the next trading setup to occur shortly.