English
  Русский
 Bahasa Indonesia
 Bahasa Malay
 ไทย
ไทย Español
 Deutsch
 Български
 Français
 Tiếng Việt
 中文
中文 বাংলা
বাংলা हिन्दी
 Čeština
 Українська
 Română

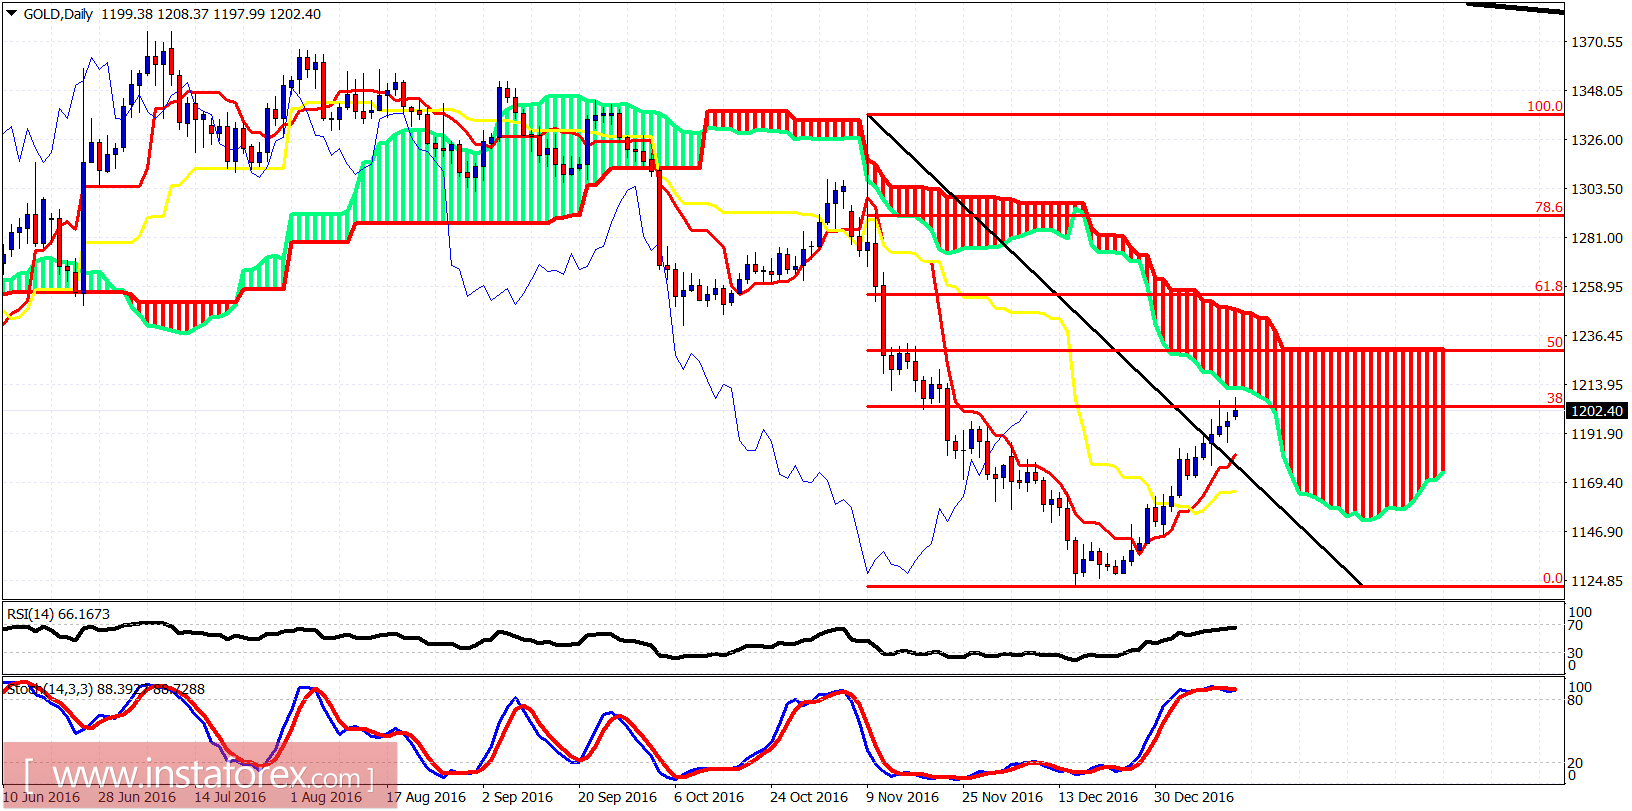
Gold price remains inside the bullish channel making higher highs and higher lows. However there are several short-term warning signs that a pullback is imminent. Bulls need to be very careful especially if price breaks below $1,187.
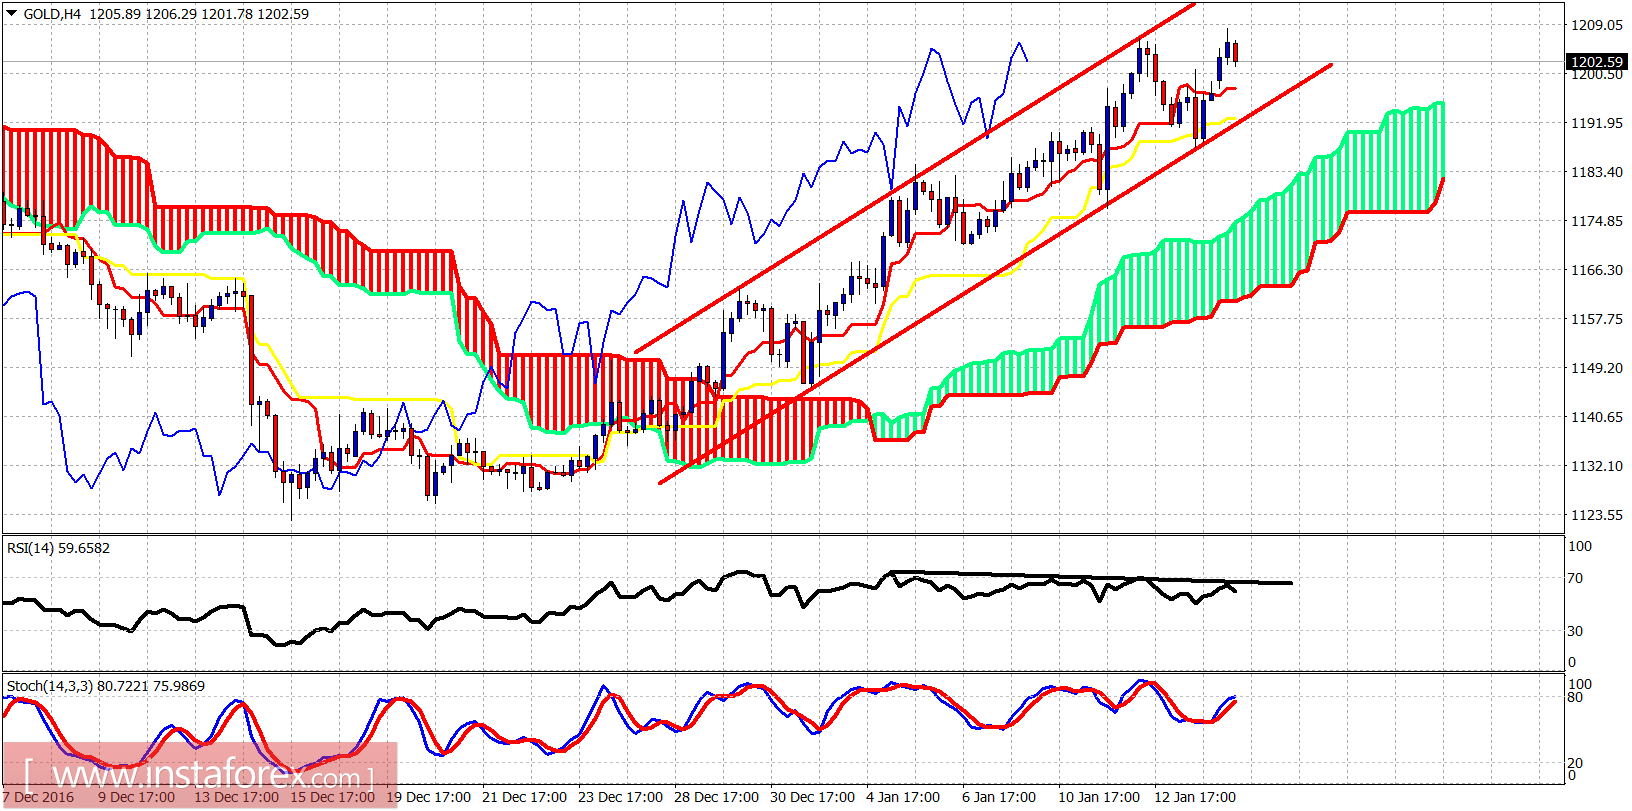
Price is above the Ichimoku cloud. The 4-hour RSI is diverging. A pullback is very close. We should at least see price move towards $1,170. Trend remains bullish. The 38% Fibonacci retracement of the entire rise is at $1,175. The 61.8% Fibo is at $1,155.