 English
  Русский
 Bahasa Indonesia
 Bahasa Malay
 ไทย
ไทย Español
 Deutsch
 Български
 Français
 Tiếng Việt
 中文
中文 বাংলা
বাংলা हिन्दी
 Čeština
 Українська
 Română

Gold price remains inside the bullish channel and is making higher highs and higher lows. Trend remains bullish in the short term. We might see a pullback towards $1,200-$1,210. There are several divergence signs but no reversal signal.
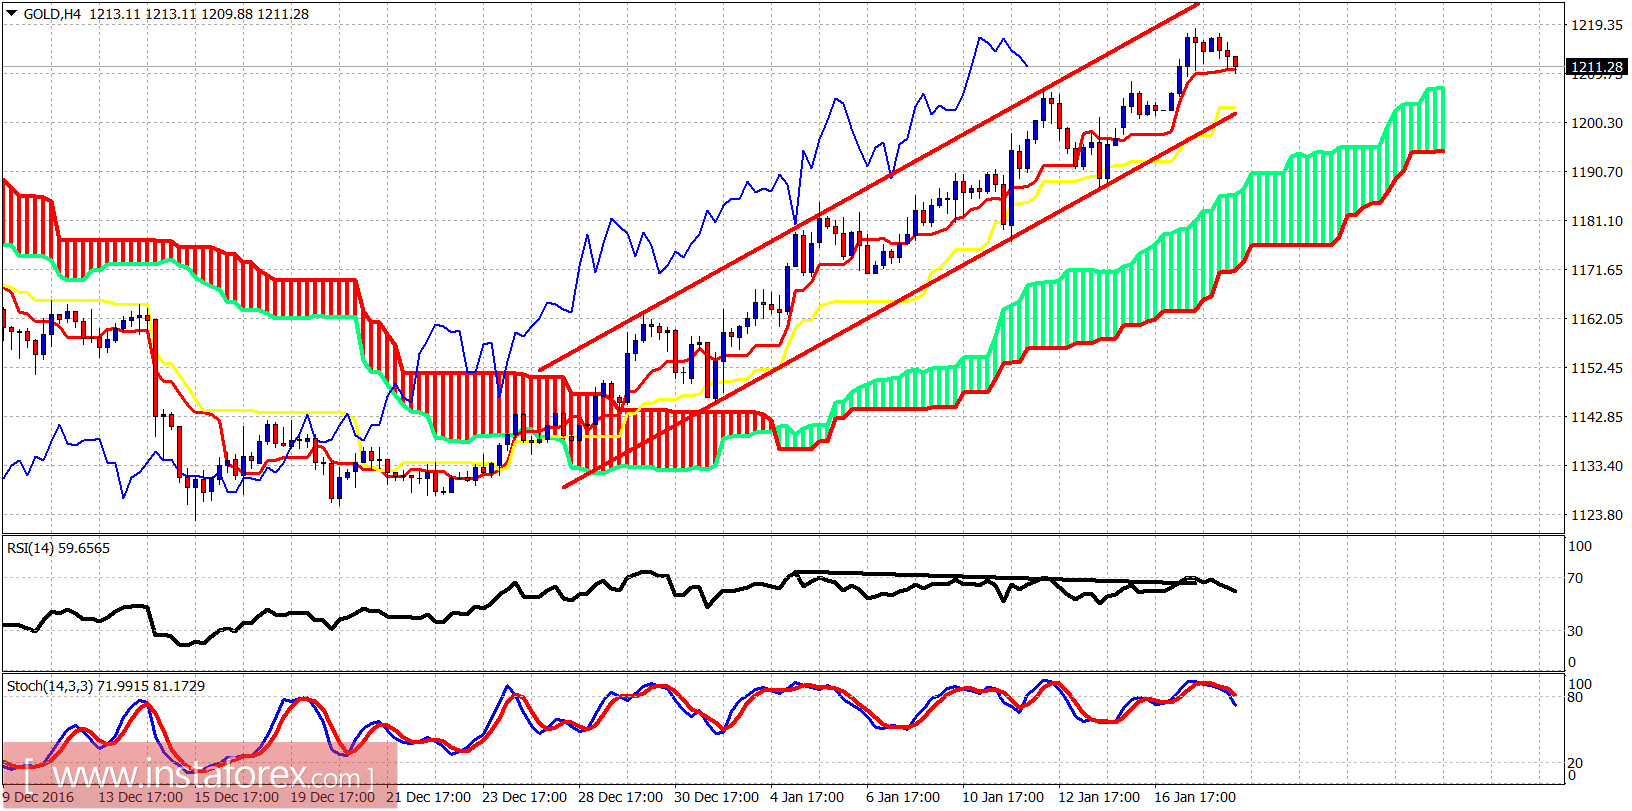
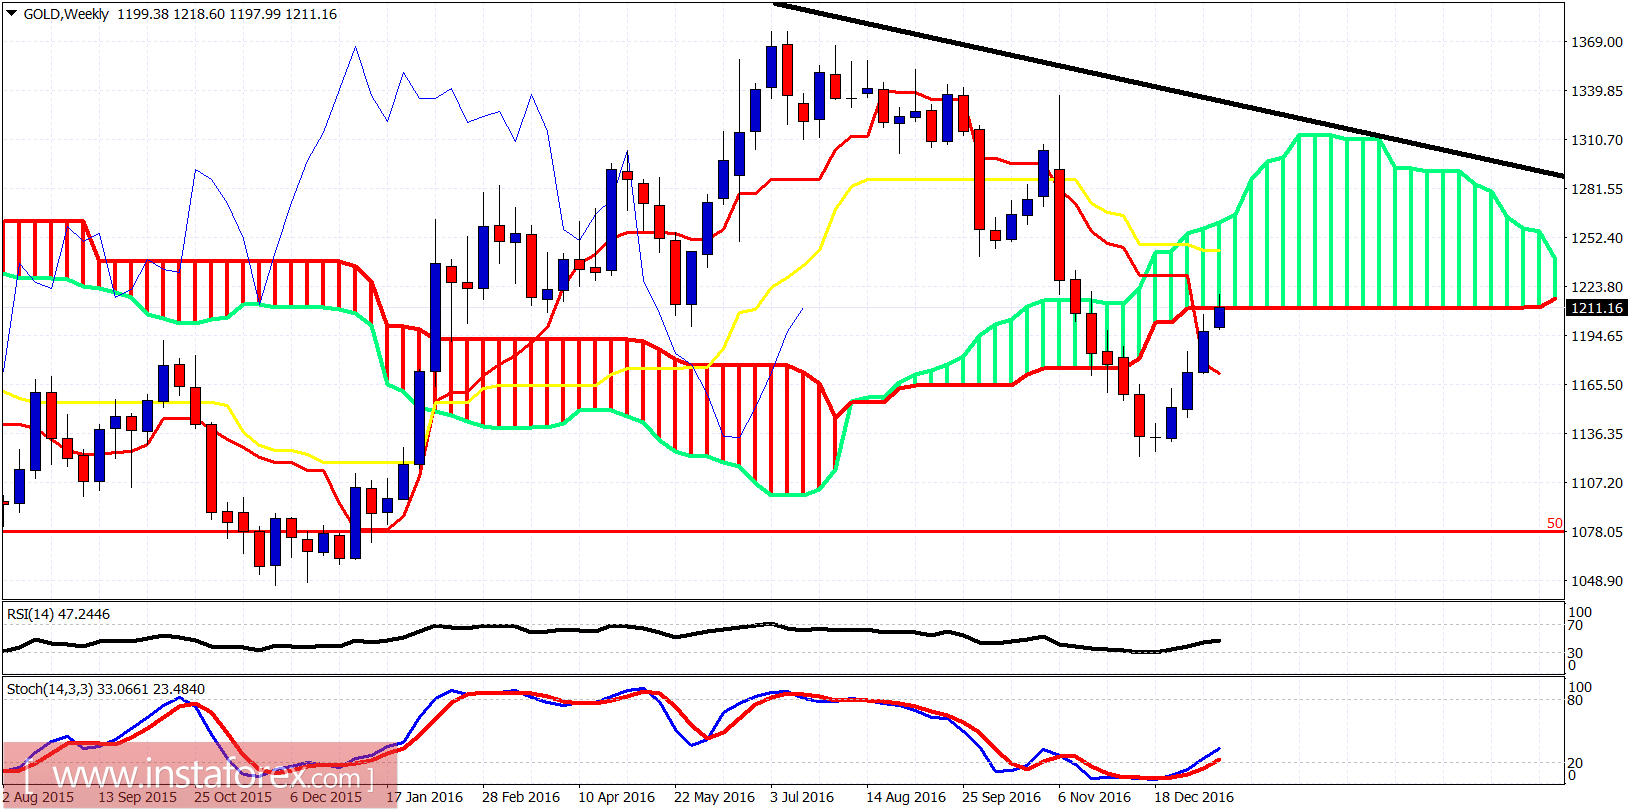
Gold price is trading above the Ichimoku cloud and inside the bullish channel. The RSI is diverging on the 4-hour chart but there is no reversal signal yet. This upward move in Gold above $1,200 increases the chances that an important long-term low is in at $1,122. Even if price pulls back, we should expect a higher low around $1,180-60 before the next big upward move.
about Gold.