English
  Русский
 Bahasa Indonesia
 Bahasa Malay
 ไทย
ไทย Español
 Deutsch
 Български
 Français
 Tiếng Việt
 中文
中文 বাংলা
বাংলা हिन्दी
 Čeština
 Українська
 Română

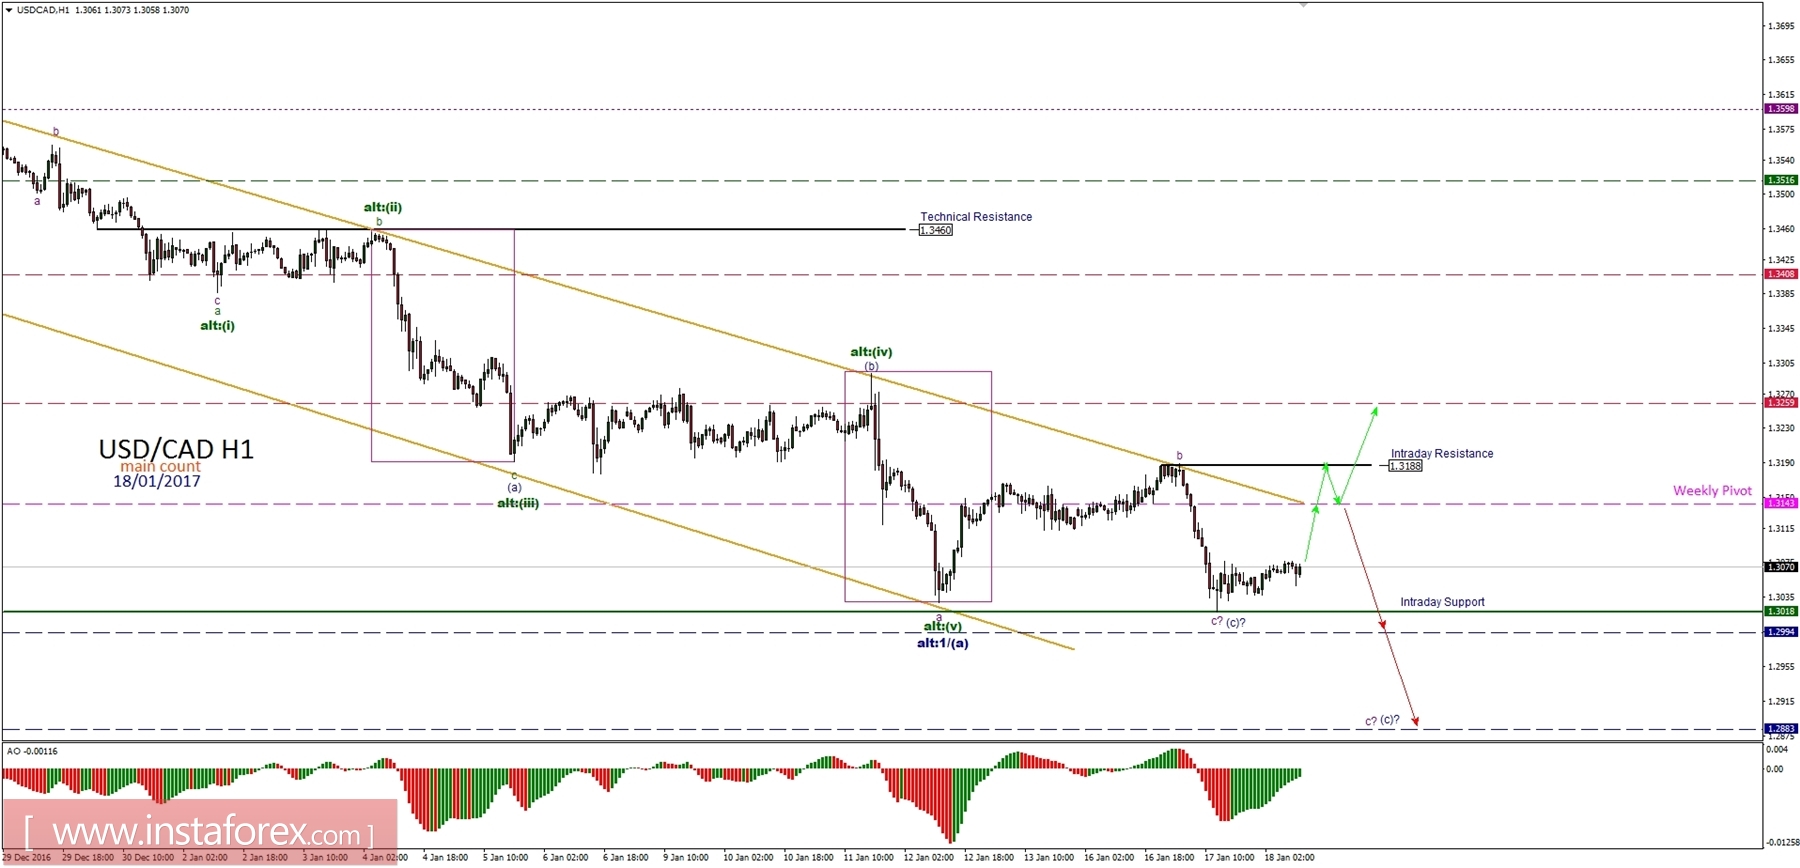
General overview for 18/01/2017:
Another marginal lower low had been made on this market, but both scenarios are still equally valid as none of the important levels were violated. The bottom for the wave c of wave (c blue) might have been placed at the level of 1.3018 and growing bullish divergence between the price and the momentum oscillator supports this view. That would suggest the market might try to break out above the intraday resistance at the level of 1.3188 and head higher towards the next resistance at the level of 1.3259. However, in case of a failure, the down leg might extend to the level of 1.2883.
Support/Resistance:
1.2883 - WS2
1.2994 - WS1
1.3018 - Intraday Support
1.3143 - Weekly Pivot
1.3188 - Intraday Resistance
1.3259 - WR1
1.3293 - Technical Resistance
1.3408 - WR2
Trading recommendations:
Day traders should consider opening buy orders only if the level of 1.3188 is clearly violated. TP should be left open for now, while the first logical level is the weekly pivot resistance at the level of 1.3408.