 English
  Русский
 Bahasa Indonesia
 Bahasa Malay
 ไทย
ไทย Español
 Deutsch
 Български
 Français
 Tiếng Việt
 中文
中文 বাংলা
বাংলা हिन्दी
 Čeština
 Українська
 Română

GBP/USD had a very corrective day during Wednesday's session, following the UK PM May's speech about Brexit on Tuesday, which helped to skyrocket the pair above the 1.2400 handle. Currently, it's testing the support zone of 1.2272, where a breakout lower should happen to test the 200 SMA around 1.2224 at H1 chart, while a rebound can deliver another buyers' wave to test the 1.2416 level.
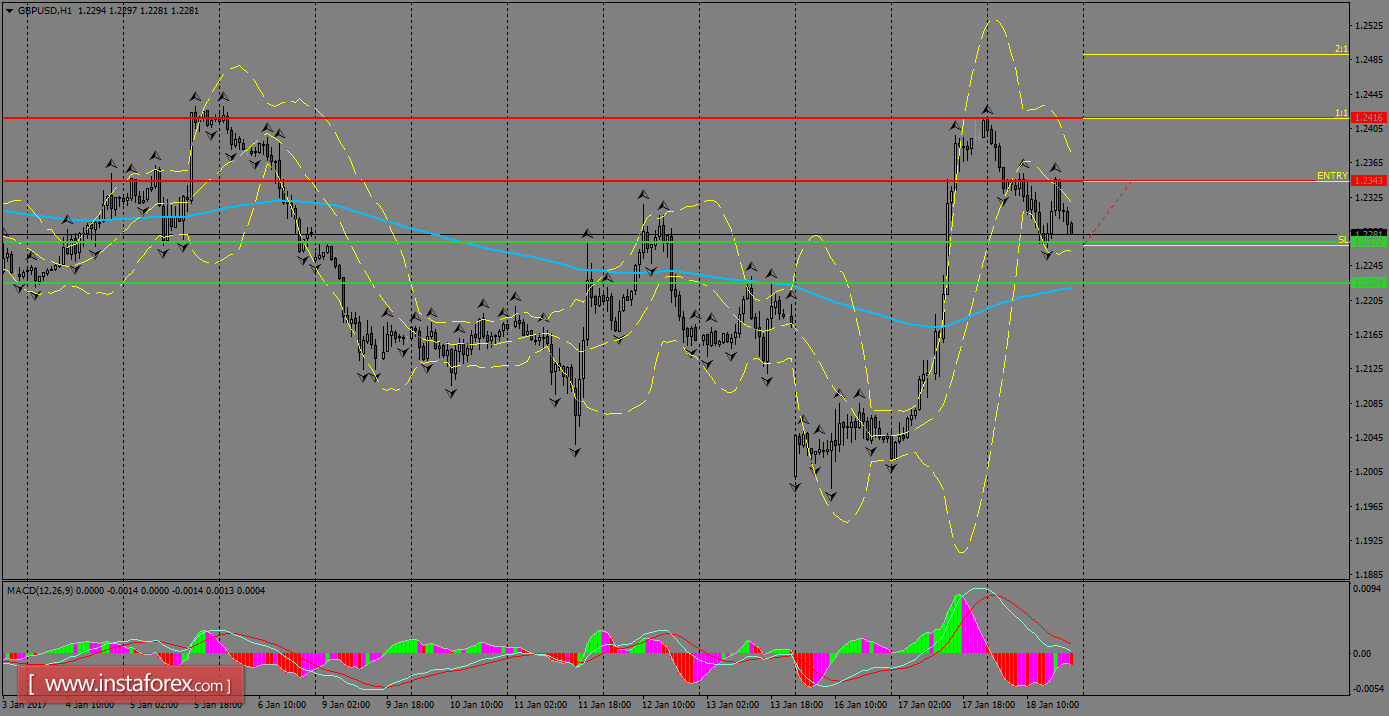
H1 chart's resistance levels: 1.2343 / 1.2416
H1 chart's support levels: 1.2371 / 1.2291
Trading recommendations for today: Based on the H1 chart, buy (long) orders only if the GBP/USD pair breaks a bullish candlestick; the resistance level is at 1.2343, take profit is at 1.2416 and stop loss is at 1.2268.