 English
  Русский
 Bahasa Indonesia
 Bahasa Malay
 ไทย
ไทย Español
 Deutsch
 Български
 Français
 Tiếng Việt
 中文
中文 বাংলা
বাংলা हिन्दी
 Čeština
 Українська
 Română

USDX recovered from Tuesday's lows and now it's heading toward the 101.06 level. The index is still trading below the 200 SMA at H1 chart and it looks like that could act as dynamic resistance across the board. However, all depends on which hints can bring Trump about fiscal policies and while the uncertainty remains there, the greenback can be under pressure. The next target to the downside is the 100.00 level.
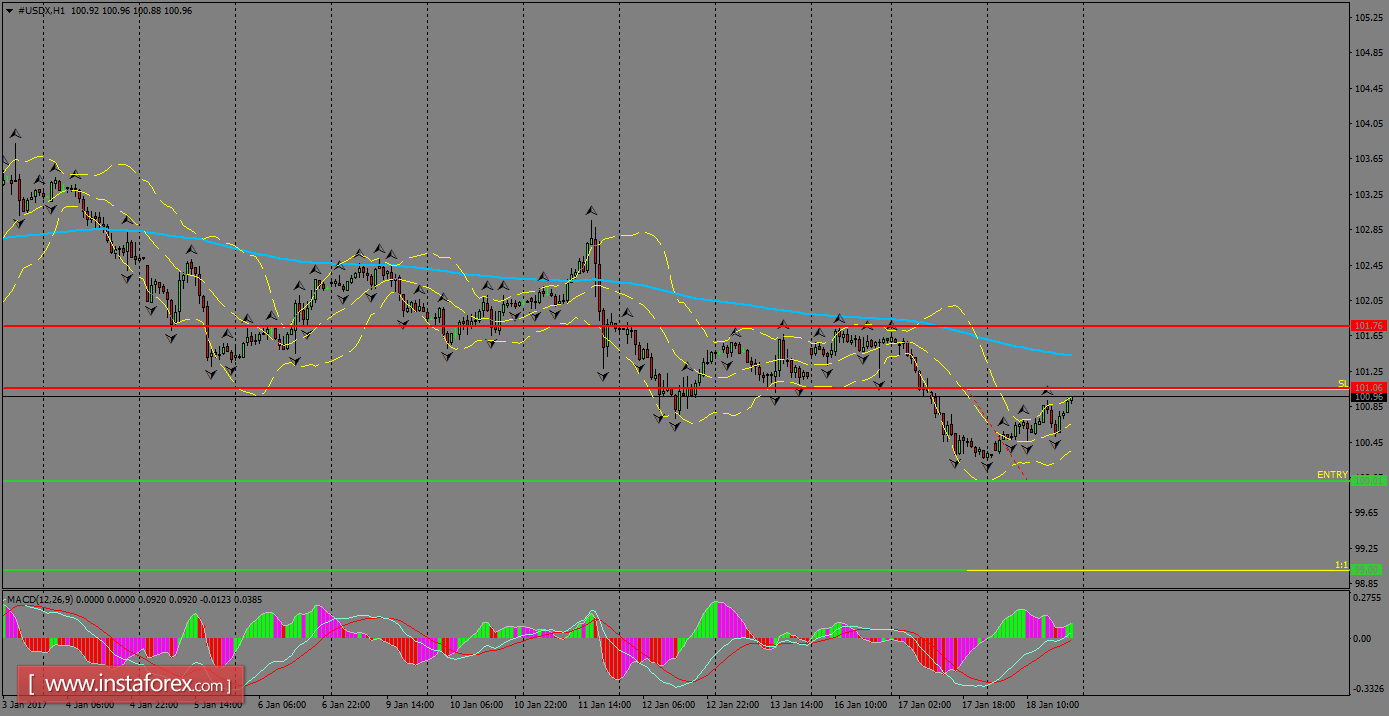
H1 chart's resistance levels: 101.06 / 101.76
H1 chart's support levels: 100.01 / 99.00
Trading recommendations for today: Based on the H1 chart, place sell (short) orders only if the USD Index breaks with a bearish candlestick; the support level is at 100.01, take profit is at 99.00 and stop loss is at 101.03.