 English
  Русский
 Bahasa Indonesia
 Bahasa Malay
 ไทย
ไทย Español
 Deutsch
 Български
 Français
 Tiếng Việt
 中文
中文 বাংলা
বাংলা हिन्दी
 Čeština
 Українська
 Română

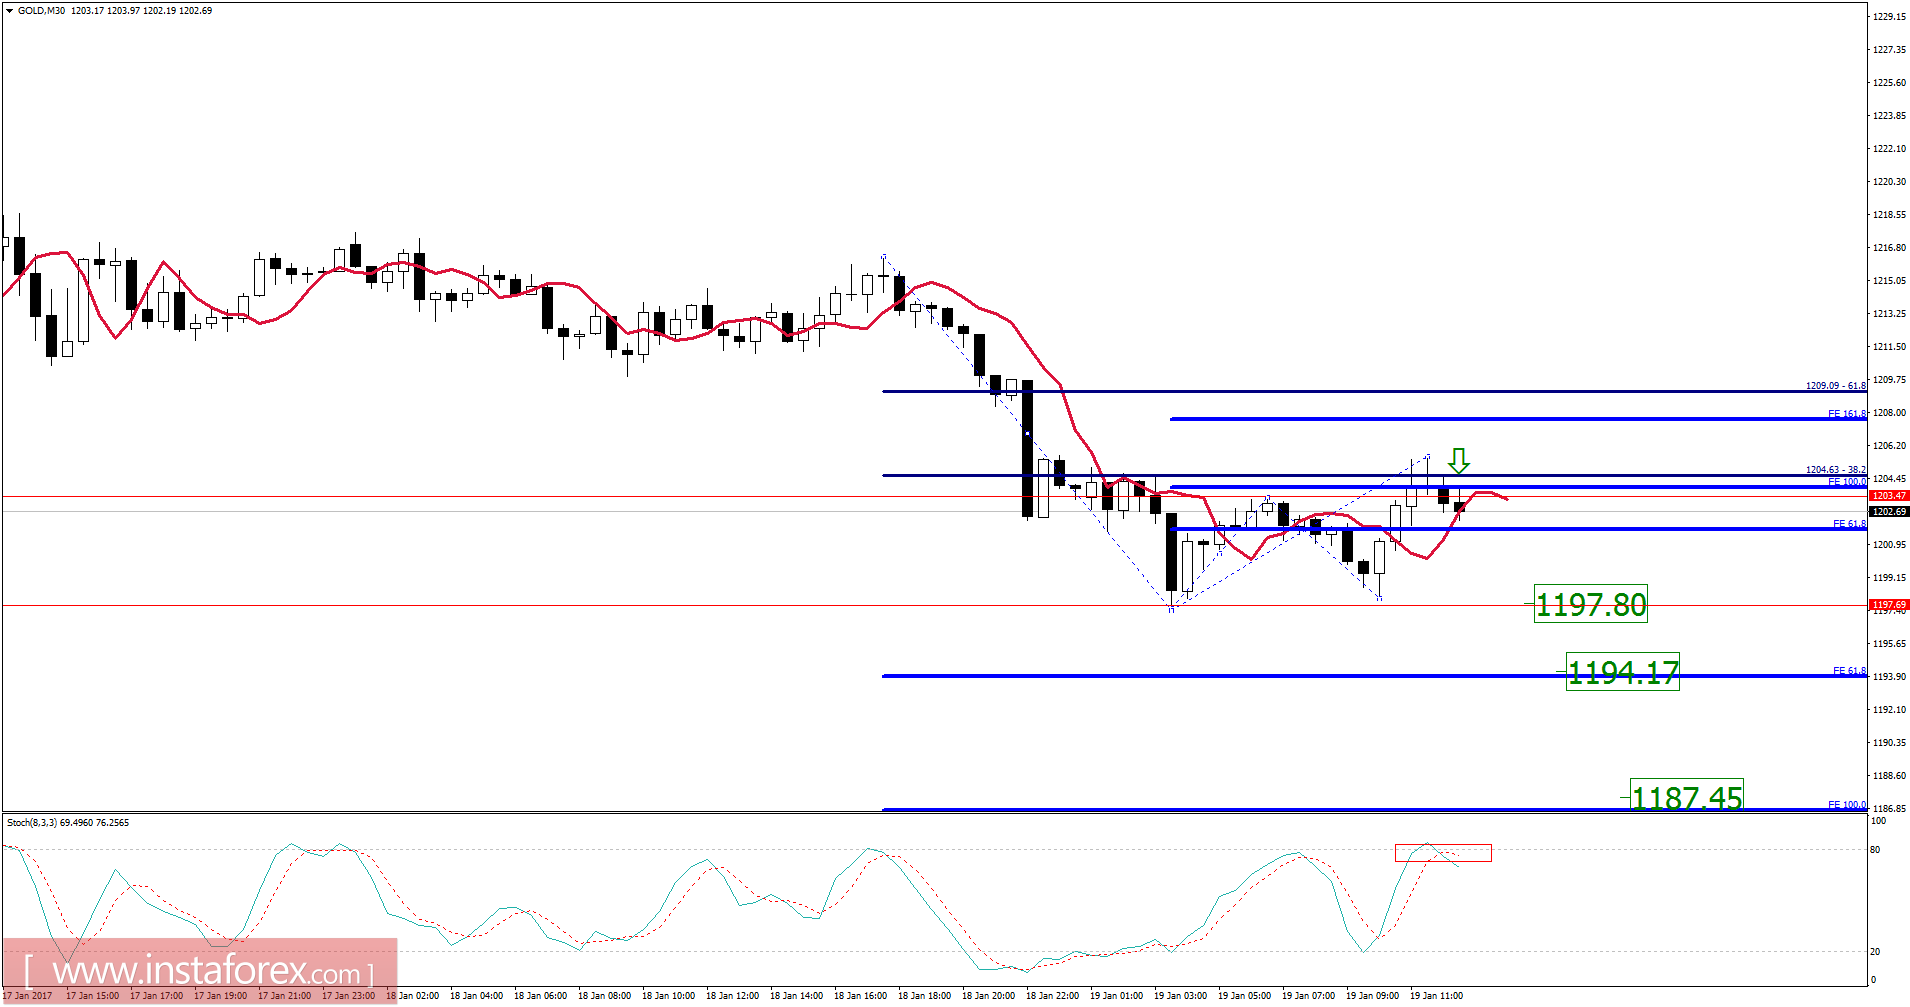
Recently, gold has been trading downwards. The price tested the level of $1,197.39. On the 30M time frame, I found strong Fibonacci resistance levels near the price of $1,204.50. There is corrective Fibonacci expansion 100% and Fibonacci retracement 38.2%. My advice is to watch for potential selling opportunities. Stochastic seems to be overbought, which is a sign that gold may go lower. I placed Fibonacci expansion to find potential downward objective points. I got Fibonacci expansion 61.8% at the price of $1,194.20 and Fibonacci expansion 100% at the price of $1,187.45.
Resistance levels:
R1: 1,214.15
R2: 1,216.65
R3: 1,221.30
Support levels:
S1: 1,205.85
S2: 1,202.50
S3: 1,198.10
Trading recommendations for today: watch for selling opportunities.