English
  Русский
 Bahasa Indonesia
 Bahasa Malay
 ไทย
ไทย Español
 Deutsch
 Български
 Français
 Tiếng Việt
 中文
中文 বাংলা
বাংলা हिन्दी
 Čeština
 Українська
 Română

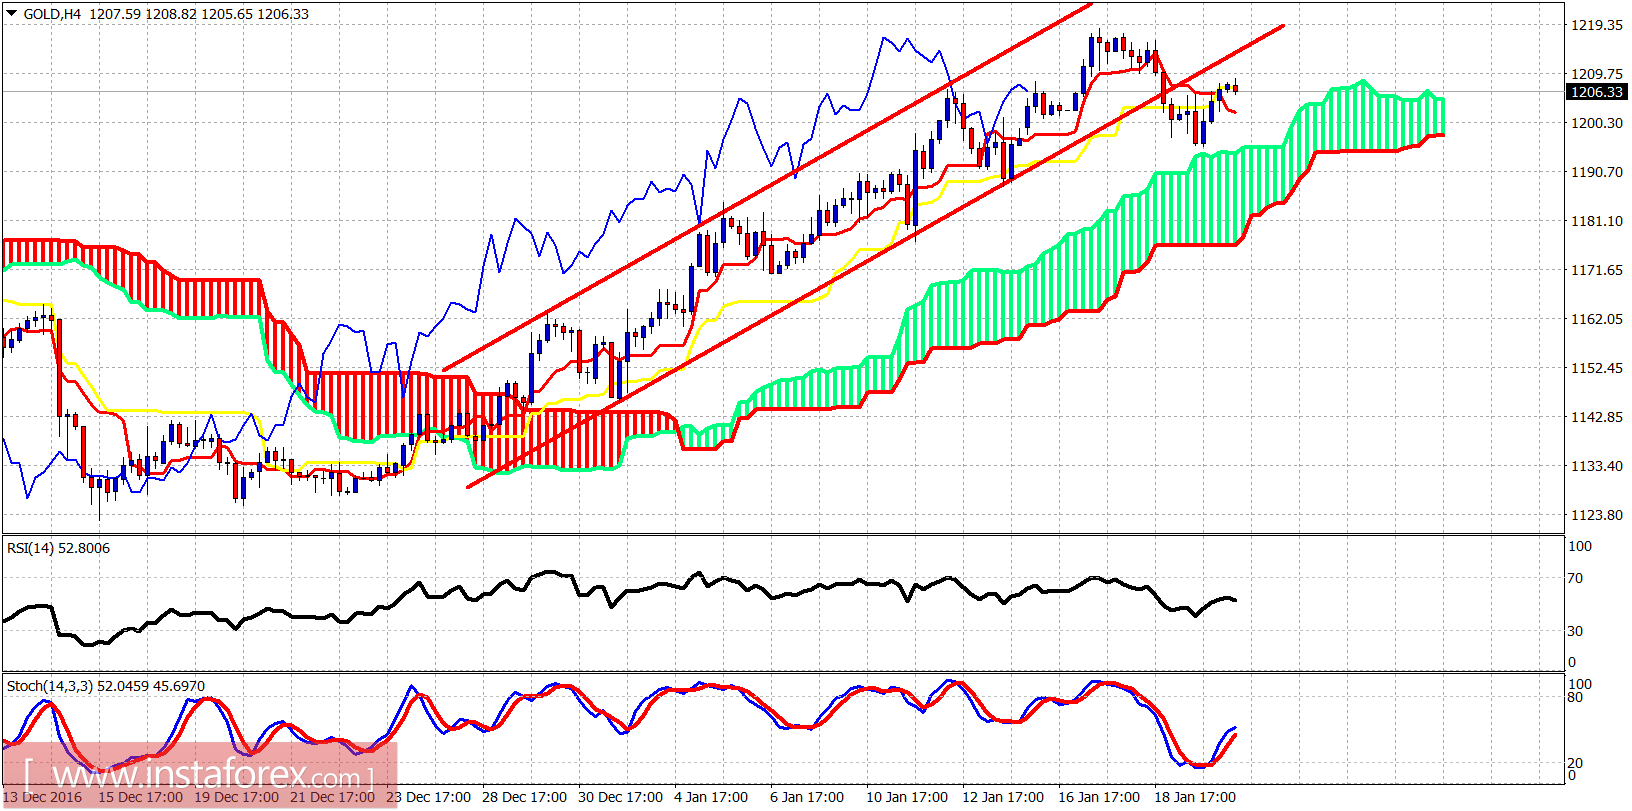
Gold price so far has made a shallow correction as low as $1,194 where prices reached the 4-hour Ichimoku cloud support and bounced back above $1,200. Gold price could see $1,210-15 today but bulls need to be very cautious as a break below $1,194 will open the way for a push towards $1,180-70.
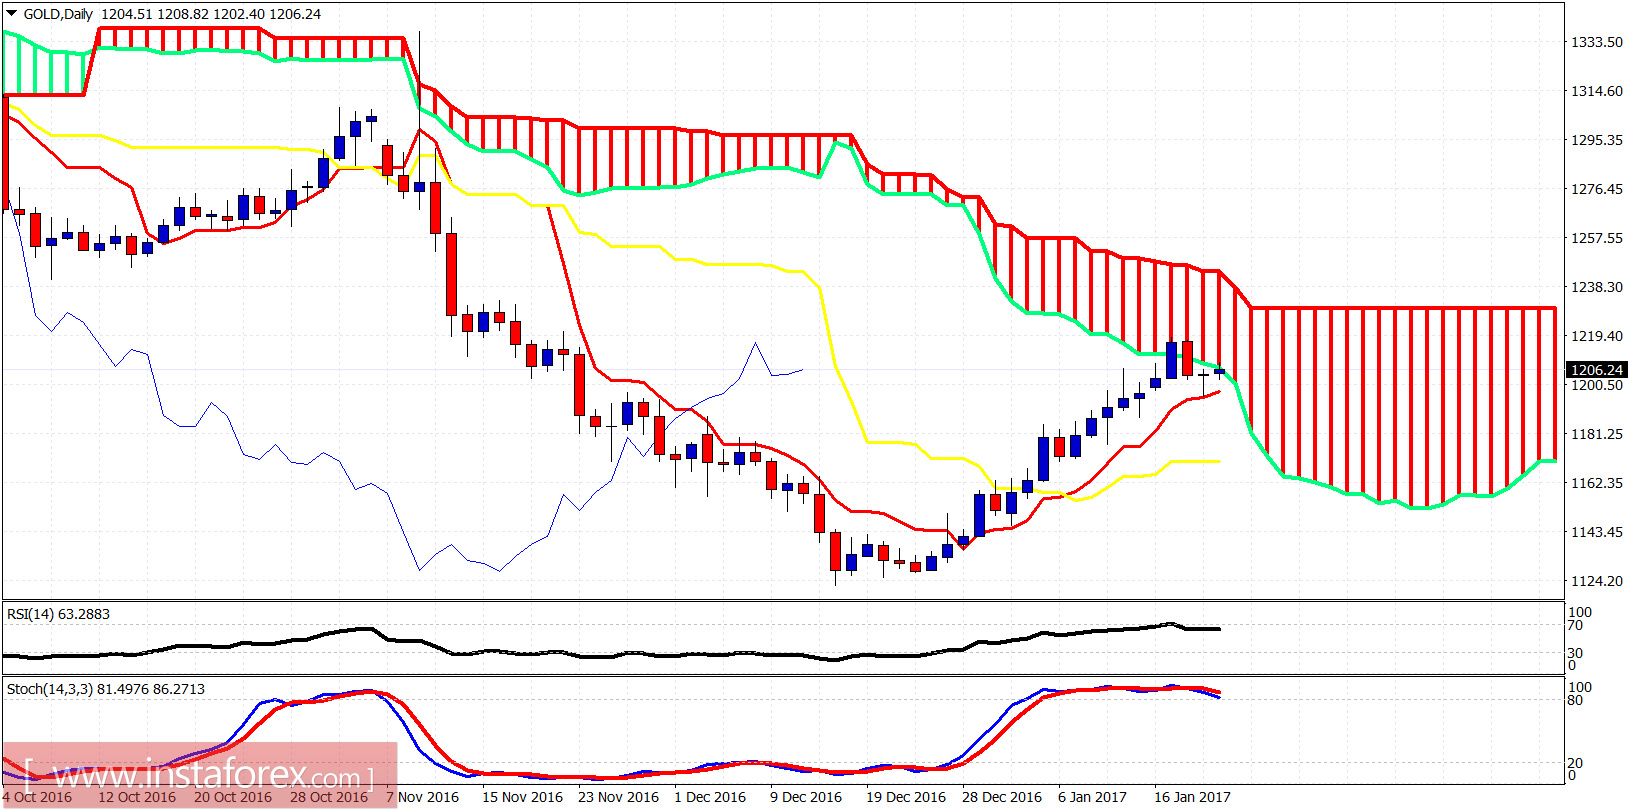
Gold price has broken out and below the bullish channel implying that Gold is in a corrective phase. This correction could push Gold price even towards $1,160 and still hold our bullish long-term scenario valid. Cloud support is at $1,194. If broken Gold price should move towards $1,180. Resistance is at $1,220.