 English
  Русский
 Bahasa Indonesia
 Bahasa Malay
 ไทย
ไทย Español
 Deutsch
 Български
 Français
 Tiếng Việt
 中文
中文 বাংলা
বাংলা हिन्दी
 Čeština
 Українська
 Română

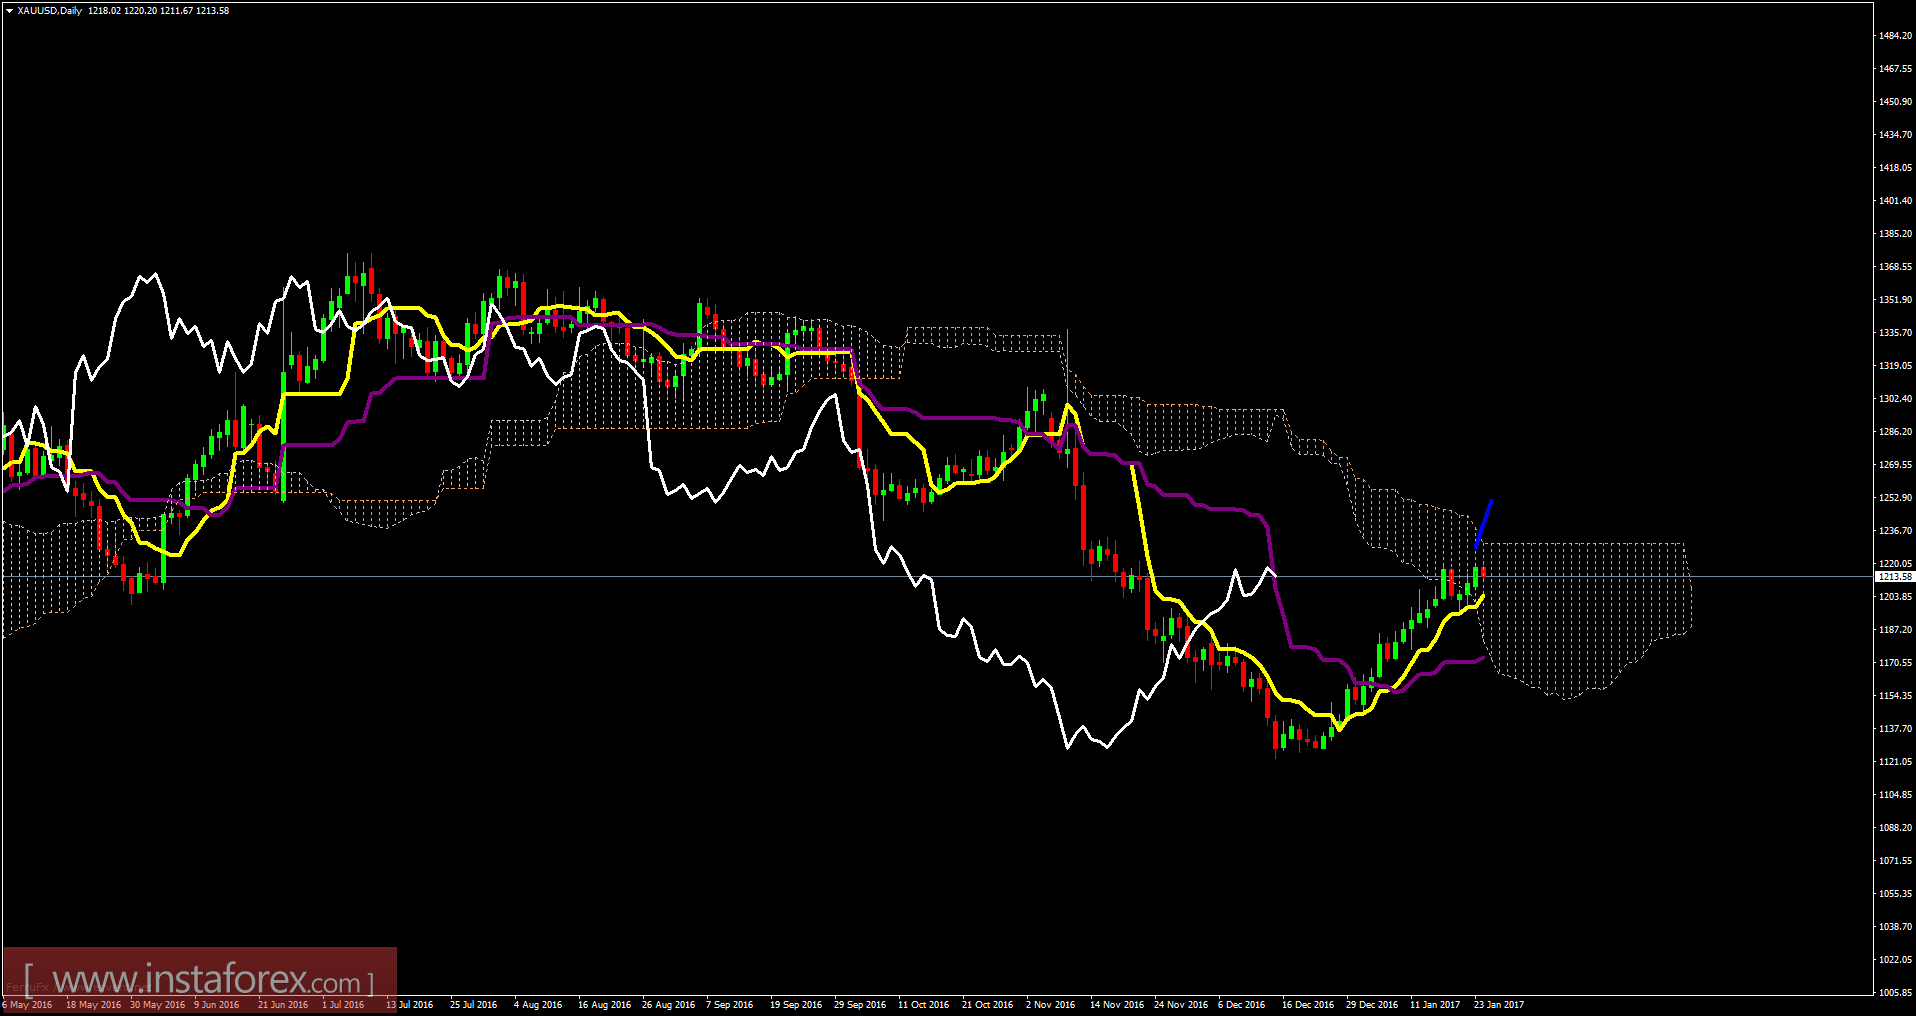
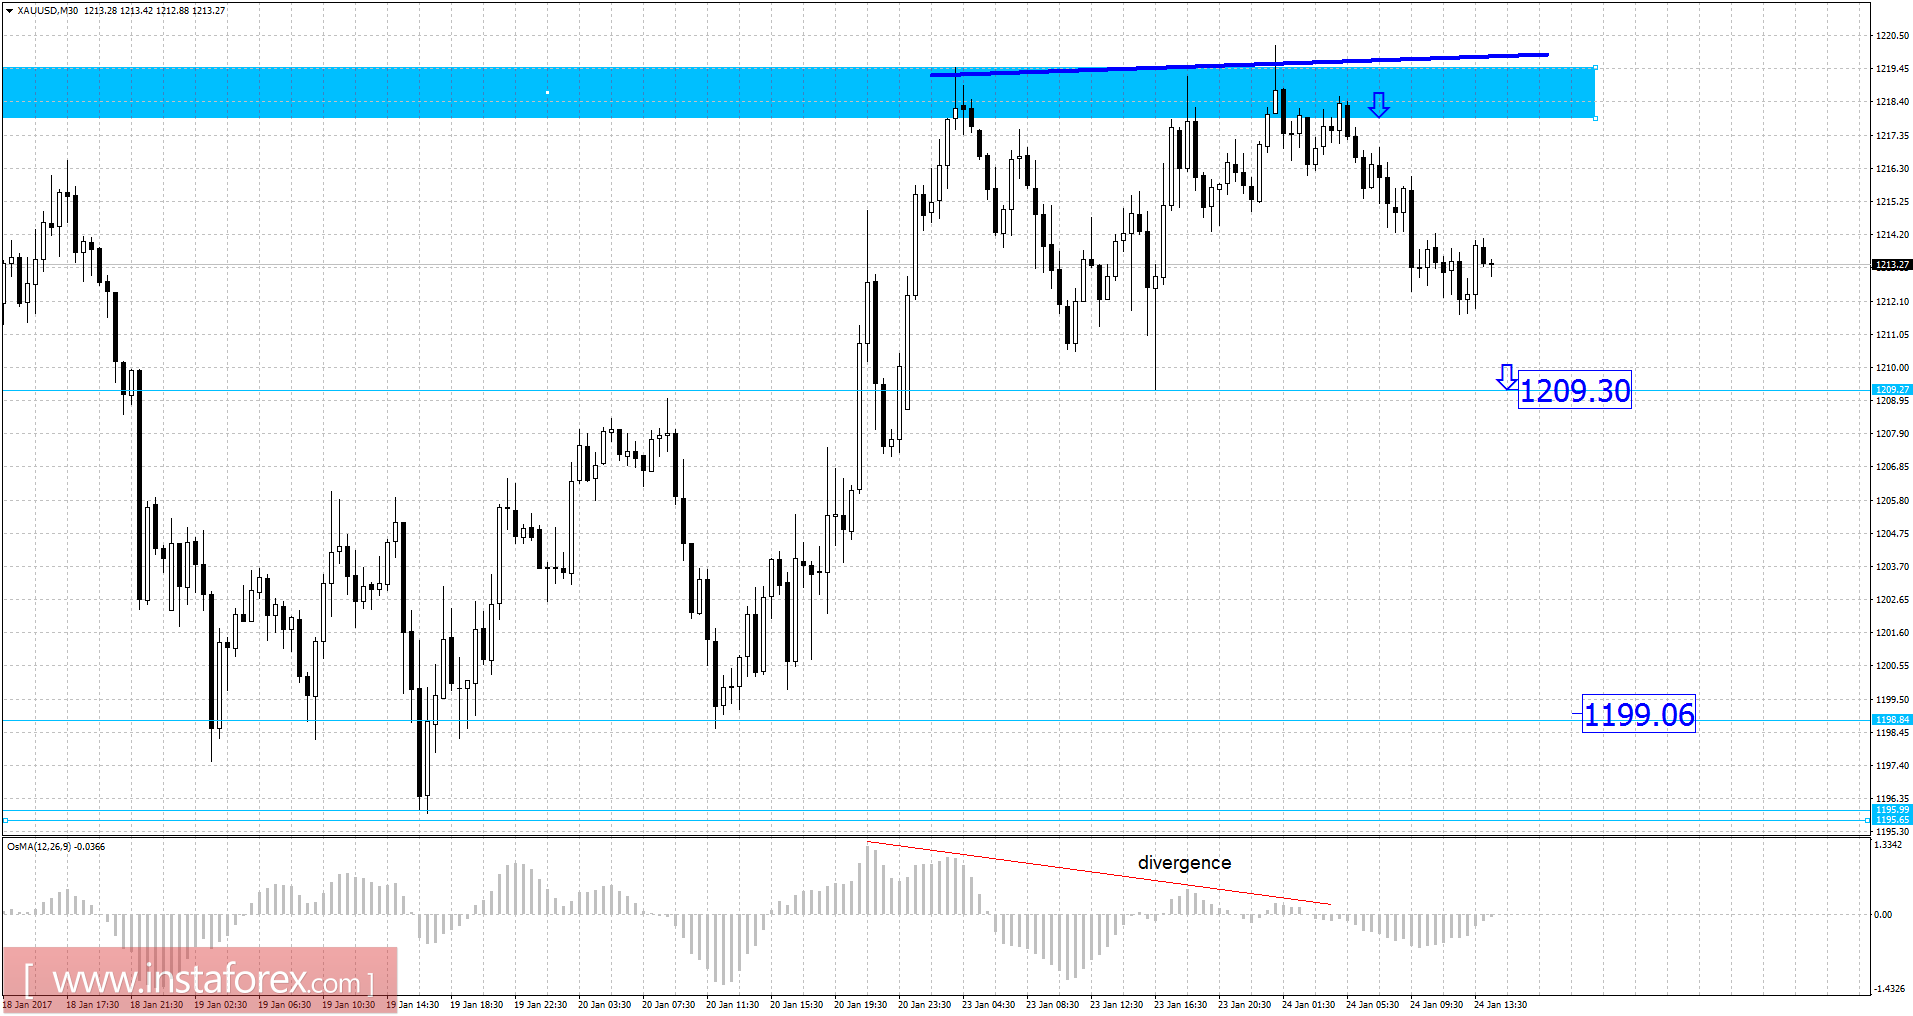
Recently, gold has been trading sideways at the price of $1,213.00. In the Daily time frame and using the Ichimoku cloud, I found that price is in the Ichimoku Cloud (equilibrium). The trend according to the daily time frame is neutral to bearish. According to the 30M time frame, I found potential double top formation and bearish divergence on Moving Average Oscilator, which is a sign of weakness. Anyway, to confirm this view price should break the level of $1,209.30. If the price breaks the level of $1,209.30, Gold may visit the level of $1,199.00 - $1,196.00.
Resistance levels:
R1: 1,215.75
R2: 1,216.50
R3: 1,219.35
Support levels:
S1: 1,212.15
S2: 1,209.30
S3: 1,208.50
Trading recommendations for today: Watch for potential selling opportunities.