 English
  Русский
 Bahasa Indonesia
 Bahasa Malay
 ไทย
ไทย Español
 Deutsch
 Български
 Français
 Tiếng Việt
 中文
中文 বাংলা
বাংলা हिन्दी
 Čeština
 Українська
 Română

The Dollar index is showing signs of strength combined with a minor first bullish divergence. We might see another dip towards 99-99.40 but overall the Dollar is short-term oversold and ready for a strong bounce if not for a full reversal to new highs.
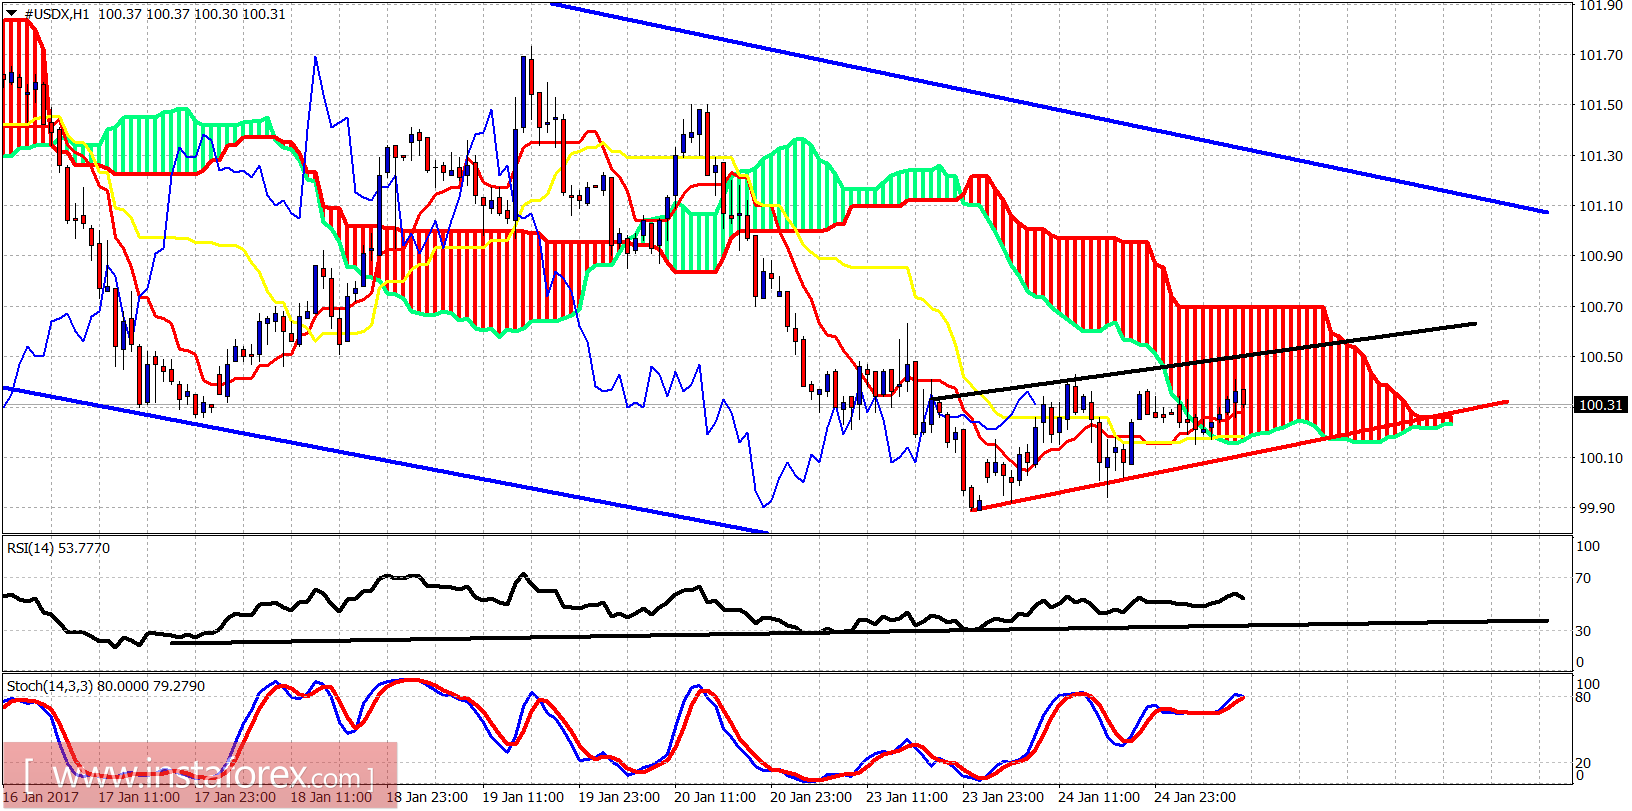
Black line - resistance
Red line - support
Blue lines - bearish channel
The Dollar index remains in a medium-term bearish trend since it topped at 103.70 and reversed. Short-term support is at 100.10 and resistance at 100.50. If we break support, then we should expect 99-99.40 to be reached. If resistance is broken, we should expect a move towards the upper channel boundary near 101.
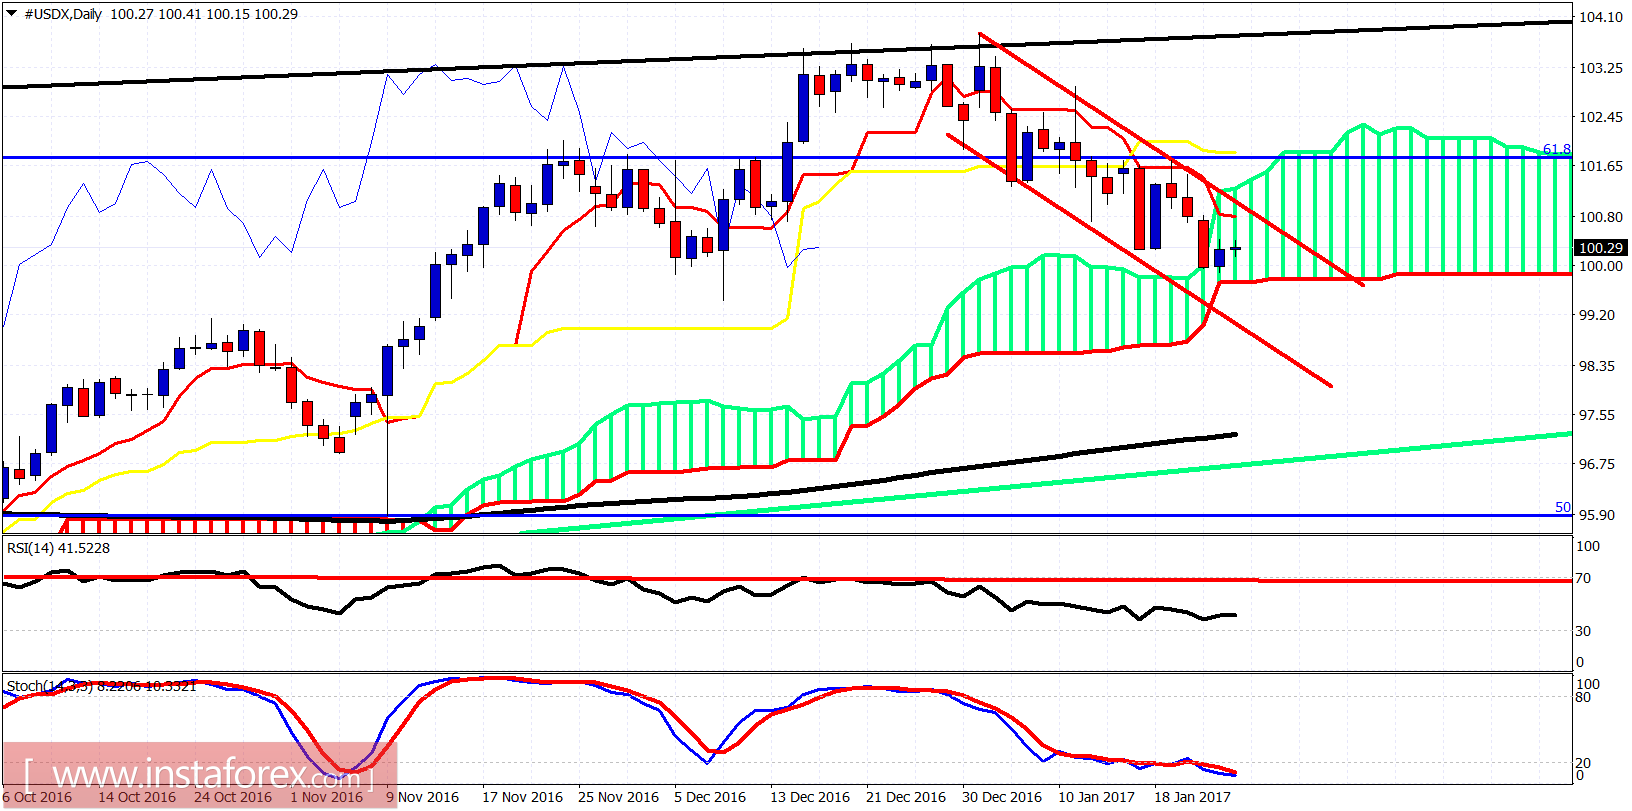
On the daily chart the index has reached the Ichimoku cloud support. Price remains inside the bearish channel. There is minor divergence in the RSI and an oversold stochastic. Important for bulls to break above 101.20 as this entire decline could very well be a wave 4 correction and the final leg up towards 105-106 could start. 97.50 is critical support for the long-term bullish trend.