 English
  Русский
 Bahasa Indonesia
 Bahasa Malay
 ไทย
ไทย Español
 Deutsch
 Български
 Français
 Tiếng Việt
 中文
中文 বাংলা
বাংলা हिन्दी
 Čeština
 Українська
 Română

The pair managed to consolidate gains above the support zone of 1.2566 and it's looking to test the 1.2645 level. The overall bullish bias remains intact, as the 200 SMA at H1 chart provided fresh momentum and it's helping GBP/USD to reach the 1.2700 psychological area. However, if we can start to witness some pullbacks across the board, Cable can plunge to test the 1.2475 level.
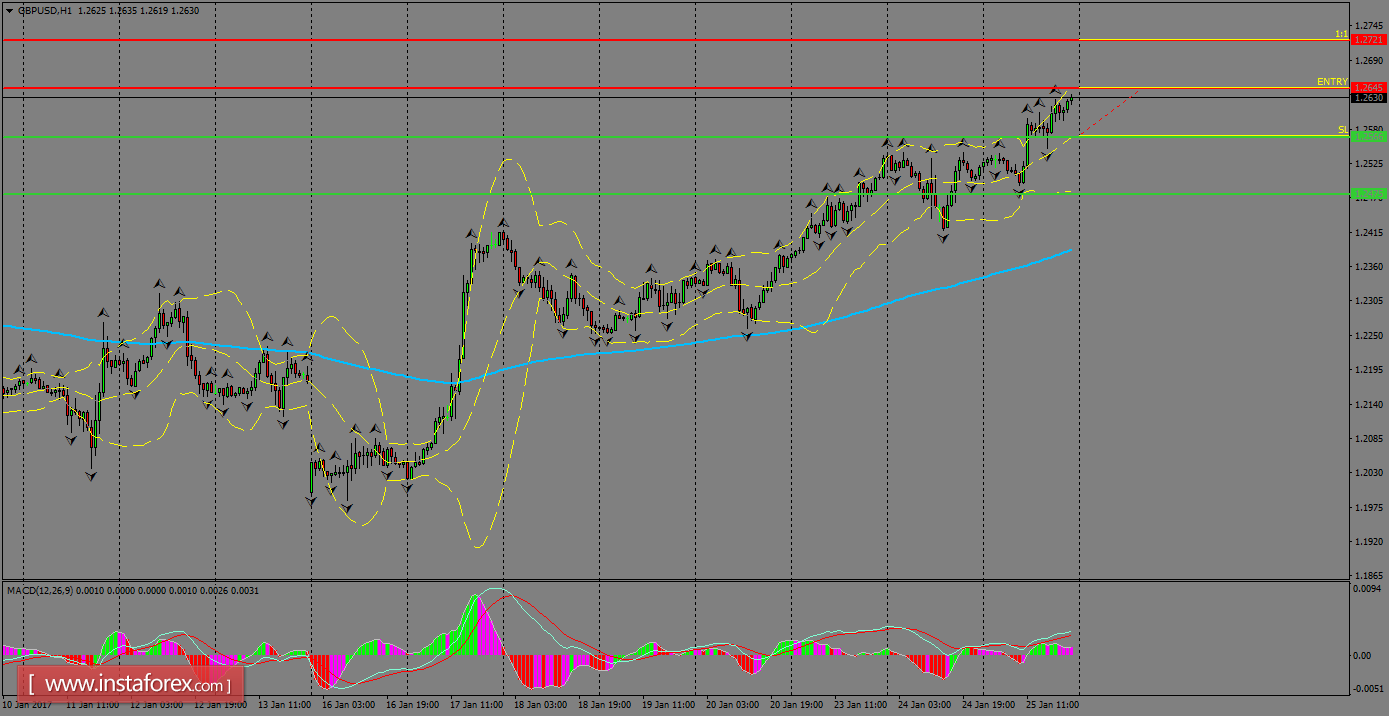
H1 chart's resistance levels: 1.2645 / 1.2721
H1 chart's support levels: 1.2566 / 1.2475
Trading recommendations for today: Based on the H1 chart, buy (long) orders only if the GBP/USD pair breaks a bullish candlestick; the resistance level is at 1.2645, take profit is at 1.2721 and stop loss is at 1.2566.