 English
  Русский
 Bahasa Indonesia
 Bahasa Malay
 ไทย
ไทย Español
 Deutsch
 Български
 Français
 Tiếng Việt
 中文
中文 বাংলা
বাংলা हिन्दी
 Čeština
 Українська
 Română

The Dollar index is finally bouncing as we expected from the start of the week. Trend however remains bearish. Price needs to break above 101.50 to confirm trend change. However I believe we are going to see the coming weeks a bullish move towards 102 at least.
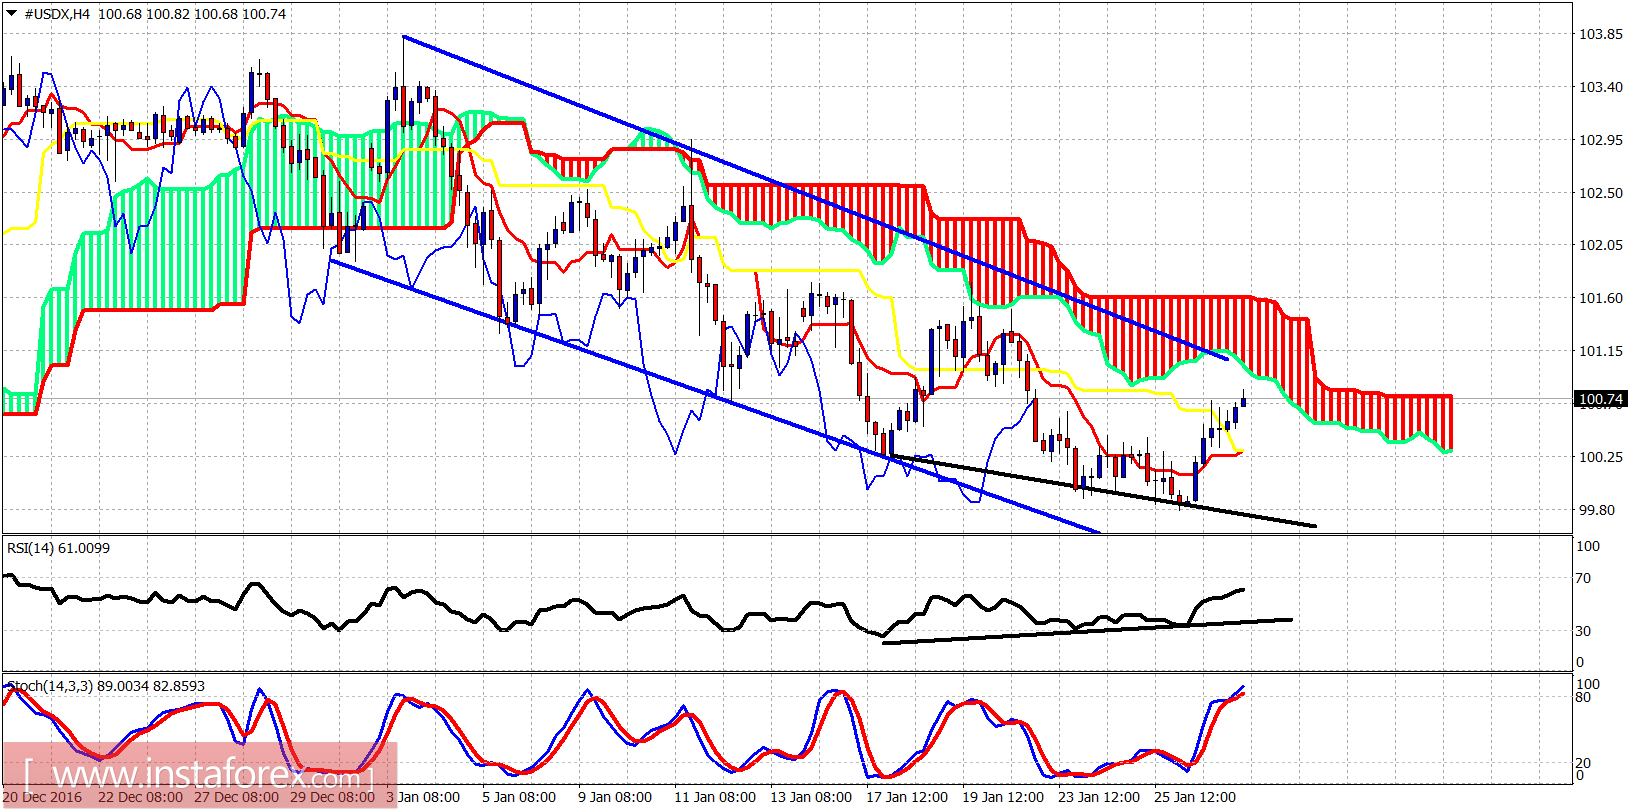
Black lines - bullish divergence
The bullish divergence signal I gave yesterday is working nicely as price has bounced towards 101 as we expected. Price is below the Ichimoku cloud. We could see a small rejection here and a pullback but I believe we will not see a lower low. I believe we will see a higher low and then resumption of the up trend.
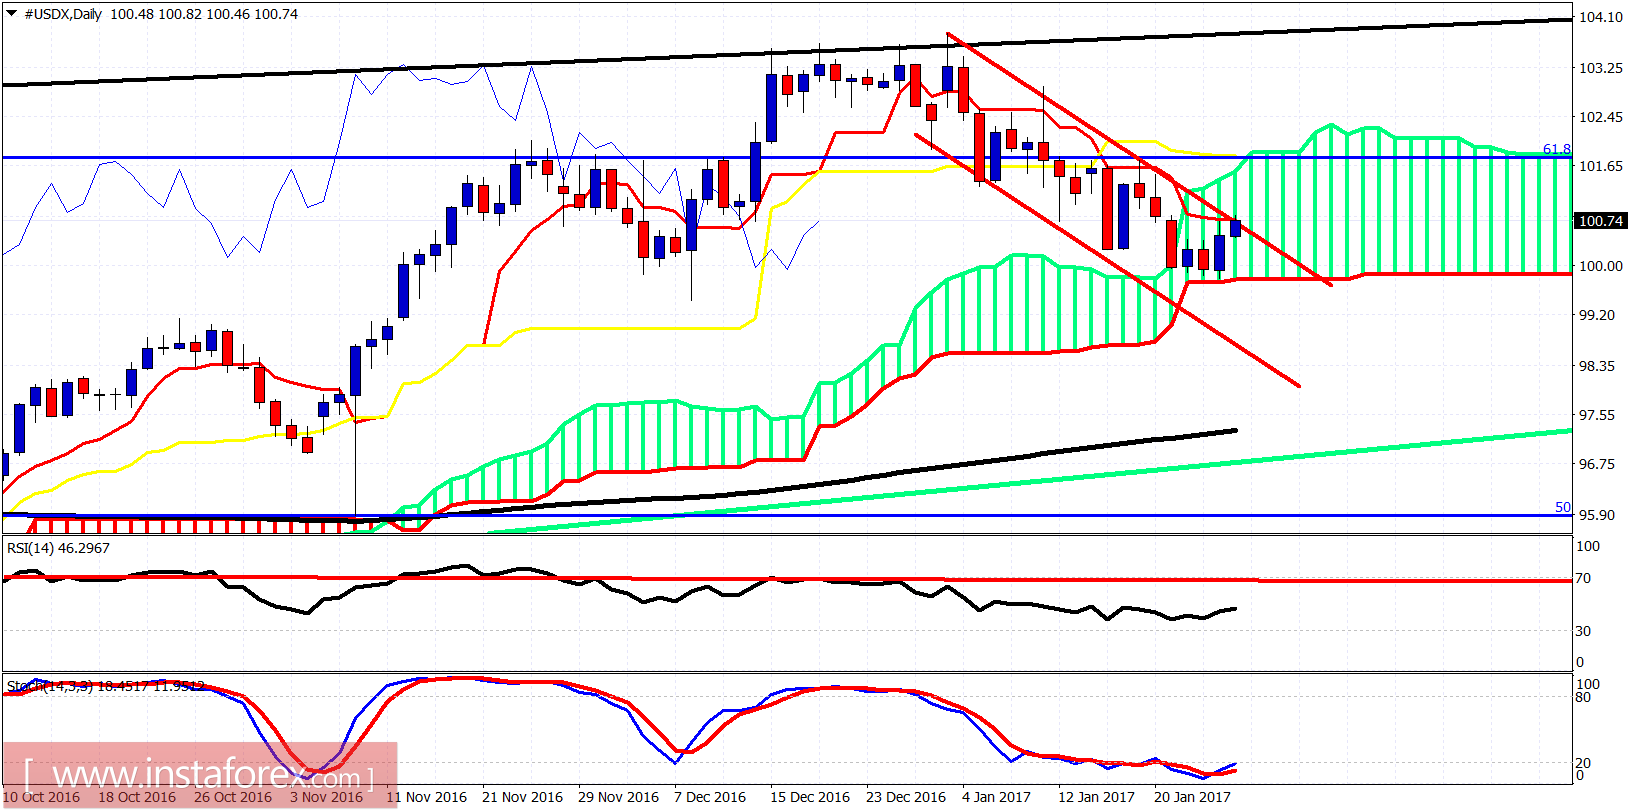
The lower cloud boundary on the daily chart has provided strong support for the Dollar index. Price is bouncing and challenging the bearish channel. A move towards the top cloud boundary should be expected. Stochastic oscillator is oversold and turning upwards. Dollar strength is expected to be seen over the coming sessions and specially next week.