 English
  Русский
 Bahasa Indonesia
 Bahasa Malay
 ไทย
ไทย Español
 Deutsch
 Български
 Français
 Tiếng Việt
 中文
中文 বাংলা
বাংলা हिन्दी
 Čeština
 Українська
 Română

The pair closed last week supported by the 1.2525 level, following a very bullish structure developed from the 200 SMA at H1 chart. GBP/USD isn't giving bearish hints yet, in terms of trend-changing price action, but a breakout below the support level of 1.2420 should strengthen that idea. However, Cable needs to consolidate above the 1.2750 zone in order to reach the 1.2900 level in the short-term.
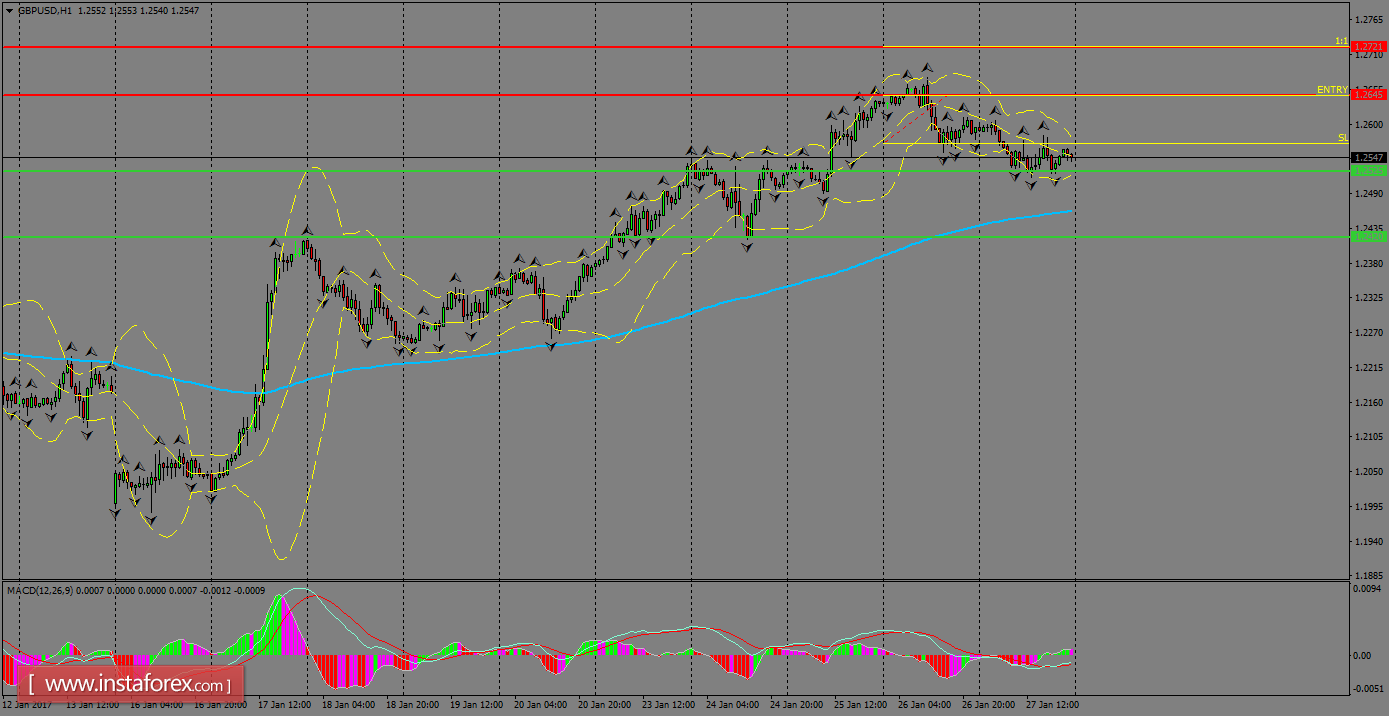
H1 chart's resistance levels: 1.2645 / 1.2721
H1 chart's support levels: 1.2525 / 1.2420
Trading recommendations for today: Based on the H1 chart, buy (long) orders only if the GBP/USD pair breaks a bullish candlestick; the resistance level is at 1.2645, take profit is at 1.2721 and stop loss is at 1.2566.