 English
  Русский
 Bahasa Indonesia
 Bahasa Malay
 ไทย
ไทย Español
 Deutsch
 Български
 Français
 Tiếng Việt
 中文
中文 বাংলা
বাংলা हिन्दी
 Čeština
 Українська
 Română

The dollar index remains in a bearish trend. The price made a lower low yesterday that was not confirmed by the RSI. We see warning divergence signs that a strong bounce could start anytime soon. Important level for a confirmed reversal is at 100.50.
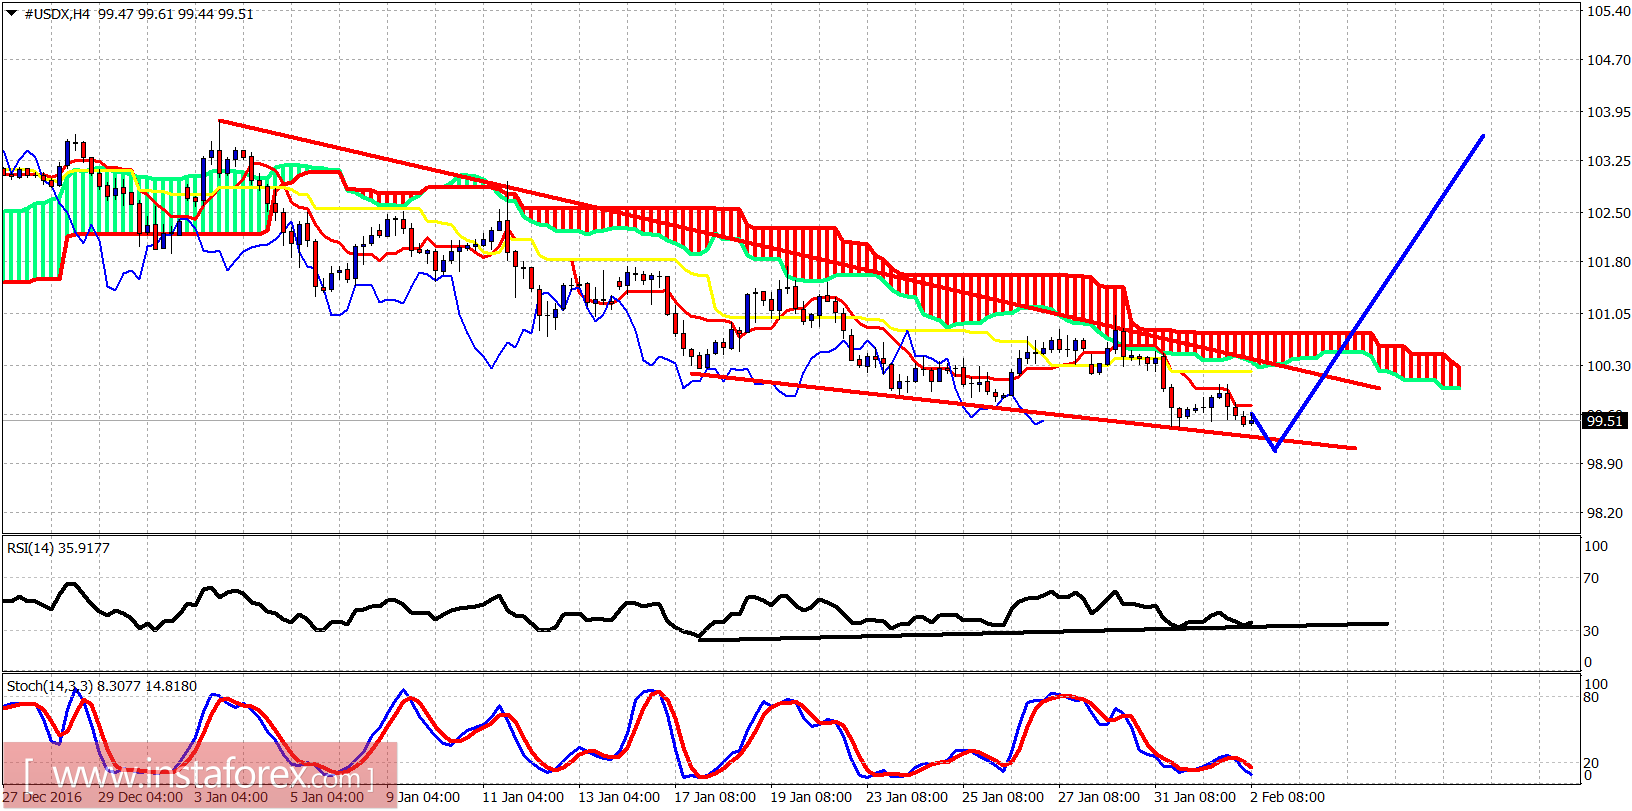
Blue lines - expected path ahead
Black line - bullish divergence sign
The dollar index continues to make lower lows and continues to trade inside the wedge and below the cloud resistance. Short-term support is at 99 and resistance at 100.50. I'm currently neutral expecting a strong reversal in the dollar index.
Red line - bearish divergence
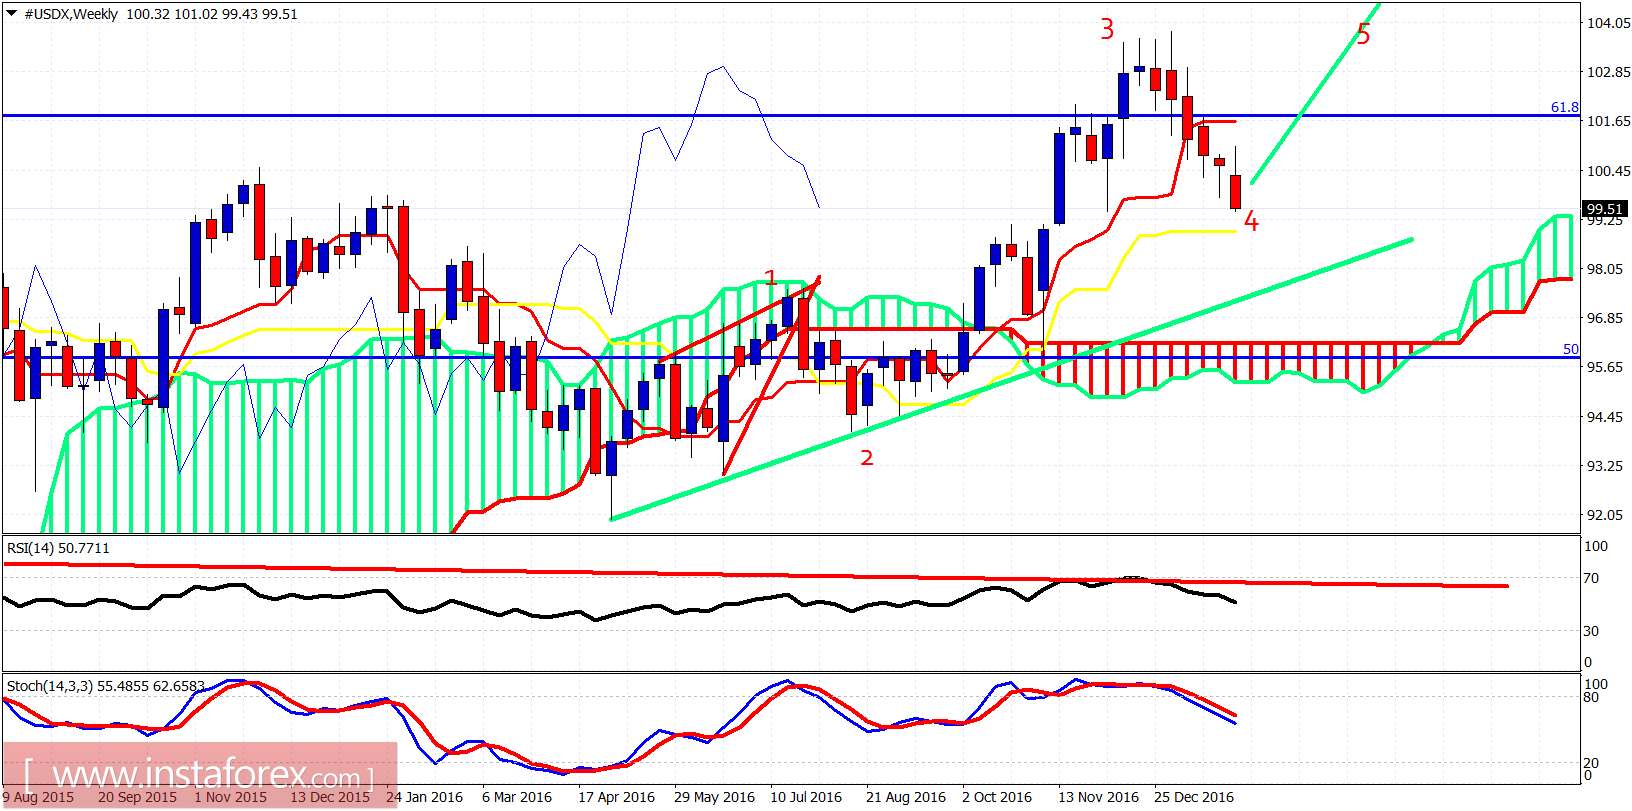
The dollar index continues moving towards our weekly target of 99 after breaking below the weekly tenkan-sen (red line indicator). Trend remains bearish in the short term but on the longer term the price could be forming wave 4 and a wave 5 up towards the level of 105.