 English
  Русский
 Bahasa Indonesia
 Bahasa Malay
 ไทย
ไทย Español
 Deutsch
 Български
 Français
 Tiếng Việt
 中文
中文 বাংলা
বাংলা हिन्दी
 Čeština
 Українська
 Română

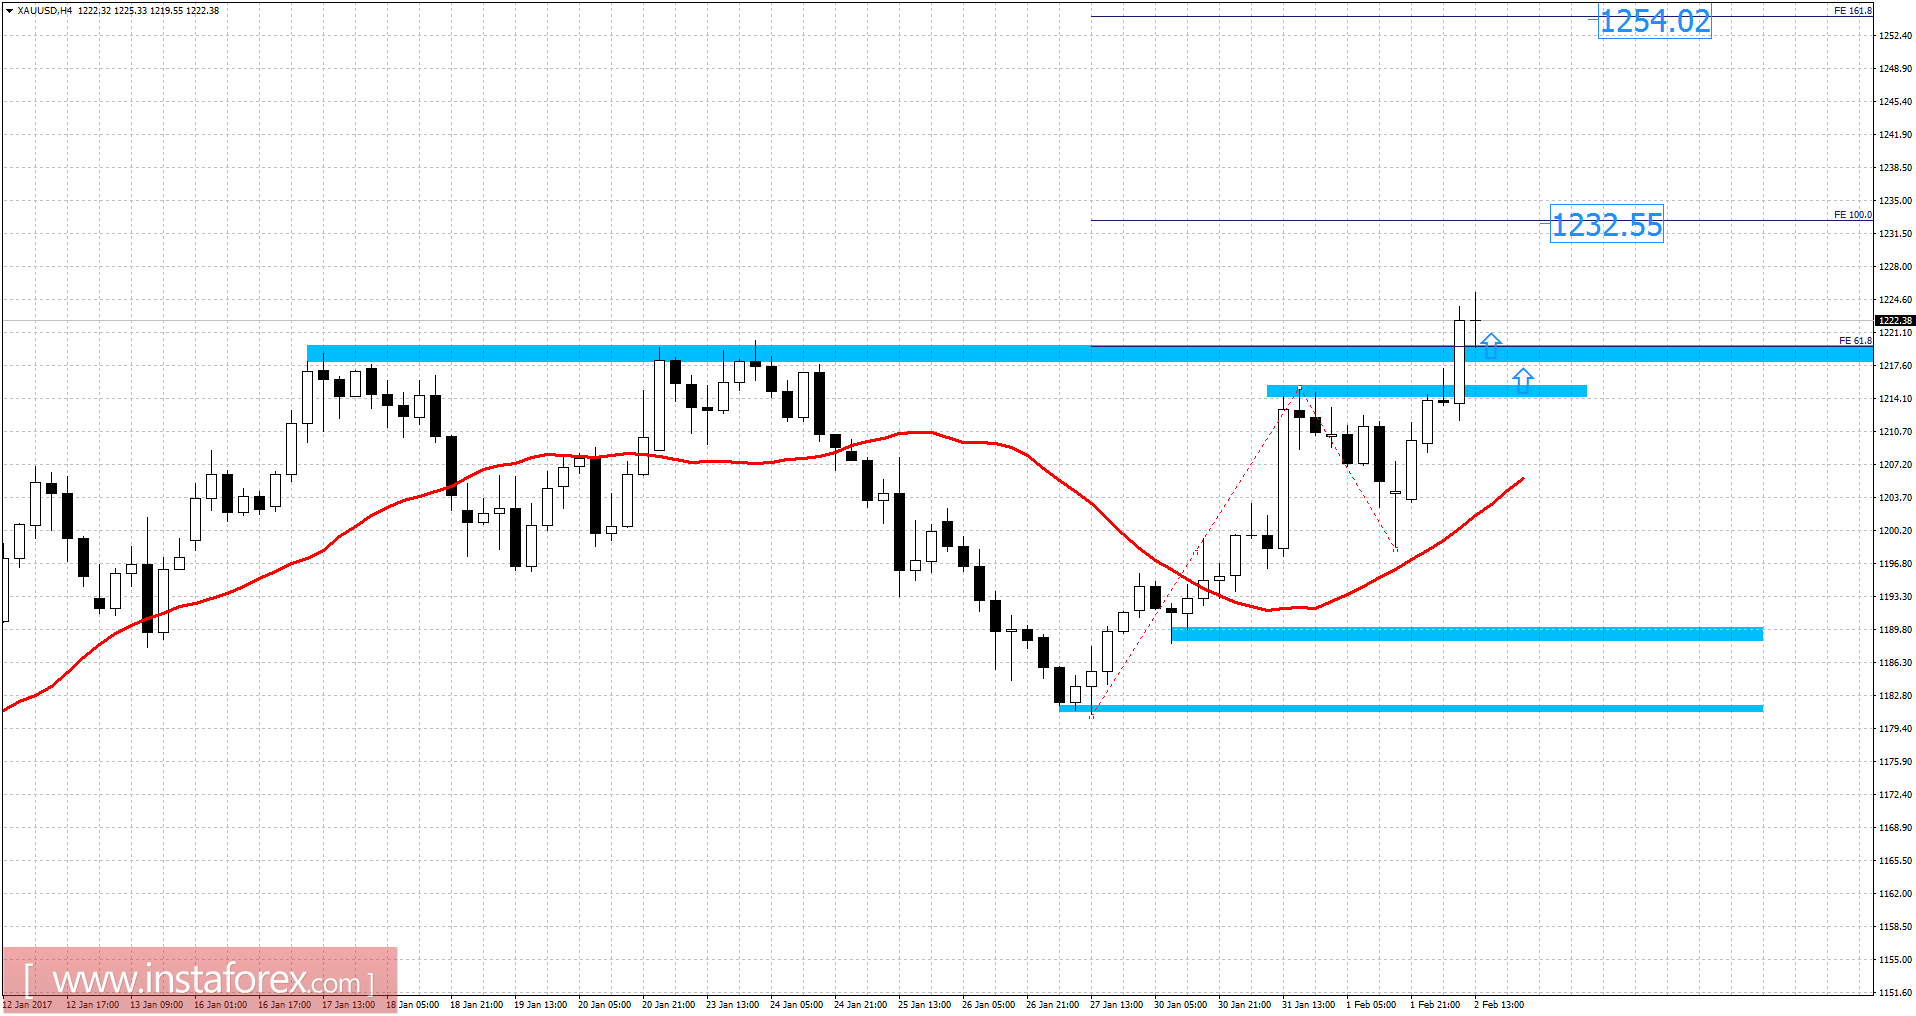
Recently, gold has been trading upwards. The price tested the level of $1,225.33. According to the 4H time frame, I found a broken resistance zone and broken Fibonacci expansion 61.8%, which is a sign of strength. I placed Fibonacci expansion to find potential upward targets. I got Fibonacci expansion 100% at the price of $1,232.55 and Fibonacci expansion 161.8% at the price of $1,254.00. Short-term trend is bullish. Watch for buying opportunities on the dips.
Fibonacci pivot points (5H)
Resistance levels:
R1: 1,227.40
R2: 1,229.60
R3: 1,233.20
Support levels:
S1: 1,200.15
S2: 1,217.90
S3: 1,214.30
Trading recommendations for today: watch for potential buying opportunities.