 English
  Русский
 Bahasa Indonesia
 Bahasa Malay
 ไทย
ไทย Español
 Deutsch
 Български
 Français
 Tiếng Việt
 中文
中文 বাংলা
বাংলা हिन्दी
 Čeština
 Українська
 Română

USDX managed to stay below the 200 SMA, as the US NFP didn't bring enough bullish momentum in order to change the overall trend for the short term. To the downside, we're expecting to see a breakout below the 99.45 level that strengthens the bearish bias, but if the index doesn't make any new lower lows, then we should expect another rally attempt to test the 100.36 level.
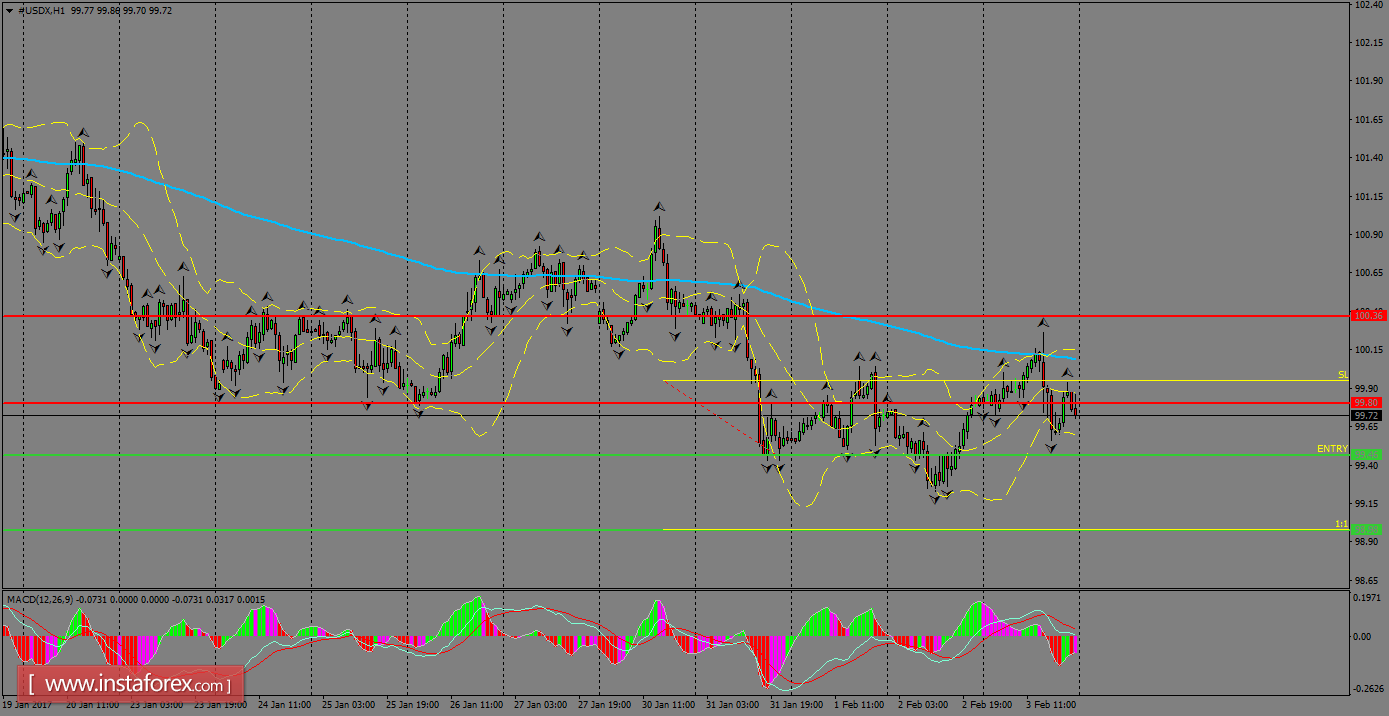
H1 chart's resistance levels: 99.80 / 100.36
H1 chart's support levels: 99.46 / 98.98
Trading recommendations for today: Based on the H1 chart, place sell (short) orders only if the USD Index breaks with a bearish candlestick; the support level is at 99.46, take profit is at 98.98 and stop loss is at 99.95.