 English
  Русский
 Bahasa Indonesia
 Bahasa Malay
 ไทย
ไทย Español
 Deutsch
 Български
 Français
 Tiếng Việt
 中文
中文 বাংলা
বাংলা हिन्दी
 Čeština
 Українська
 Română

Gold price continues to make higher highs and higher lows. The price has broken and closed above $1,212 on a weekly basis opening the road for a move towards $1,300. The trend remains bullish. As long as the price is above $1,200 bulls are in control.
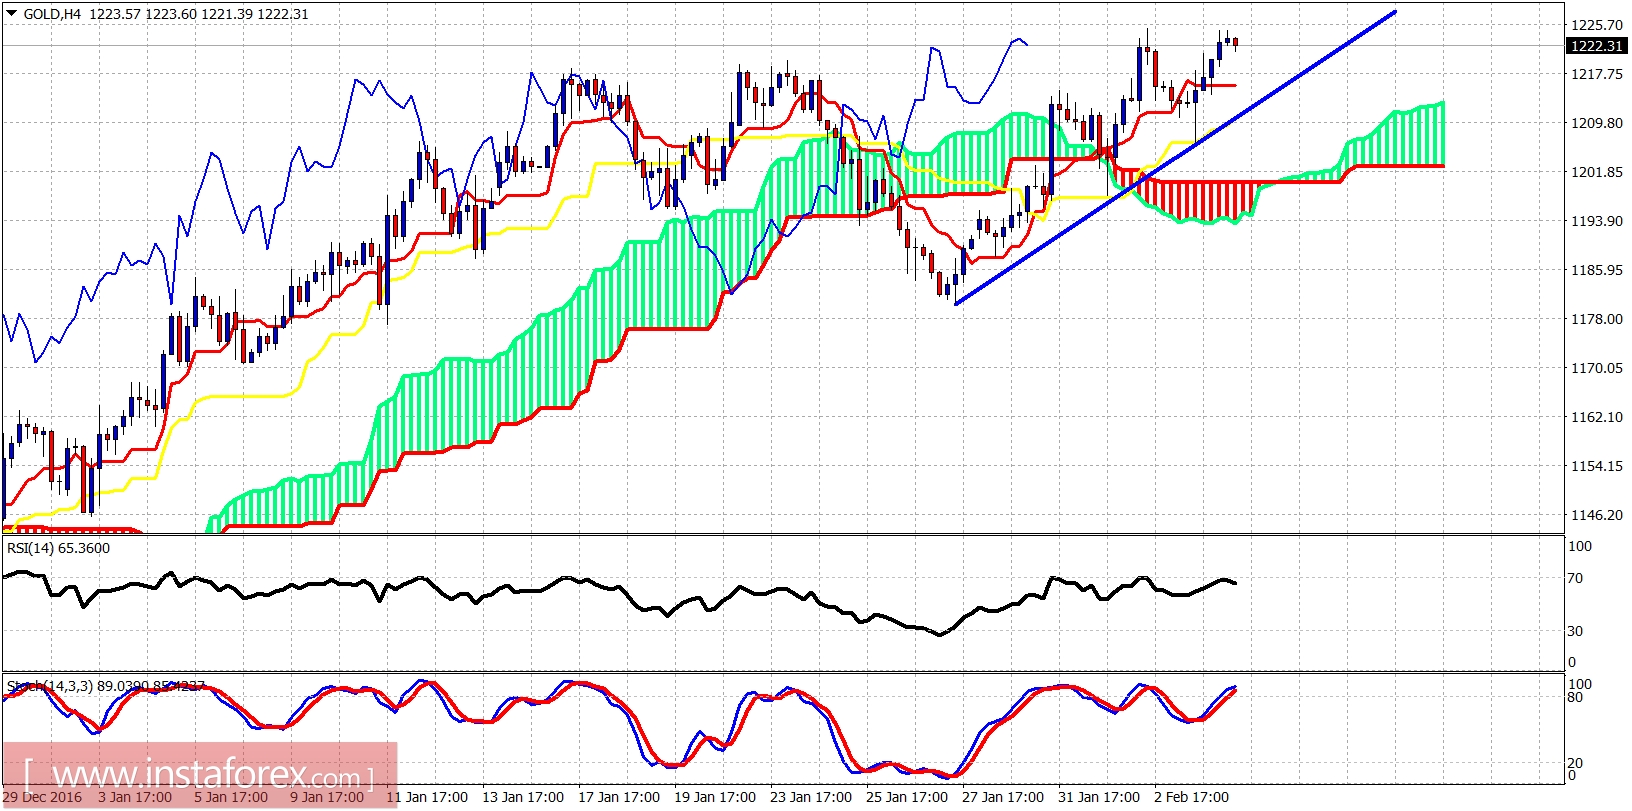
Blue line is short-term support trend line
Gold is trading above the 4-hour Ichimoku cloud. Support by the cloud is at $1,200. Trend line support is found at $1,210. Resistance is found at $1,230 and the next is at $1,250 for the short-term. As long as the price is above the cloud and above $1,200 short-term trend is bullish. Critical support is at $1,180.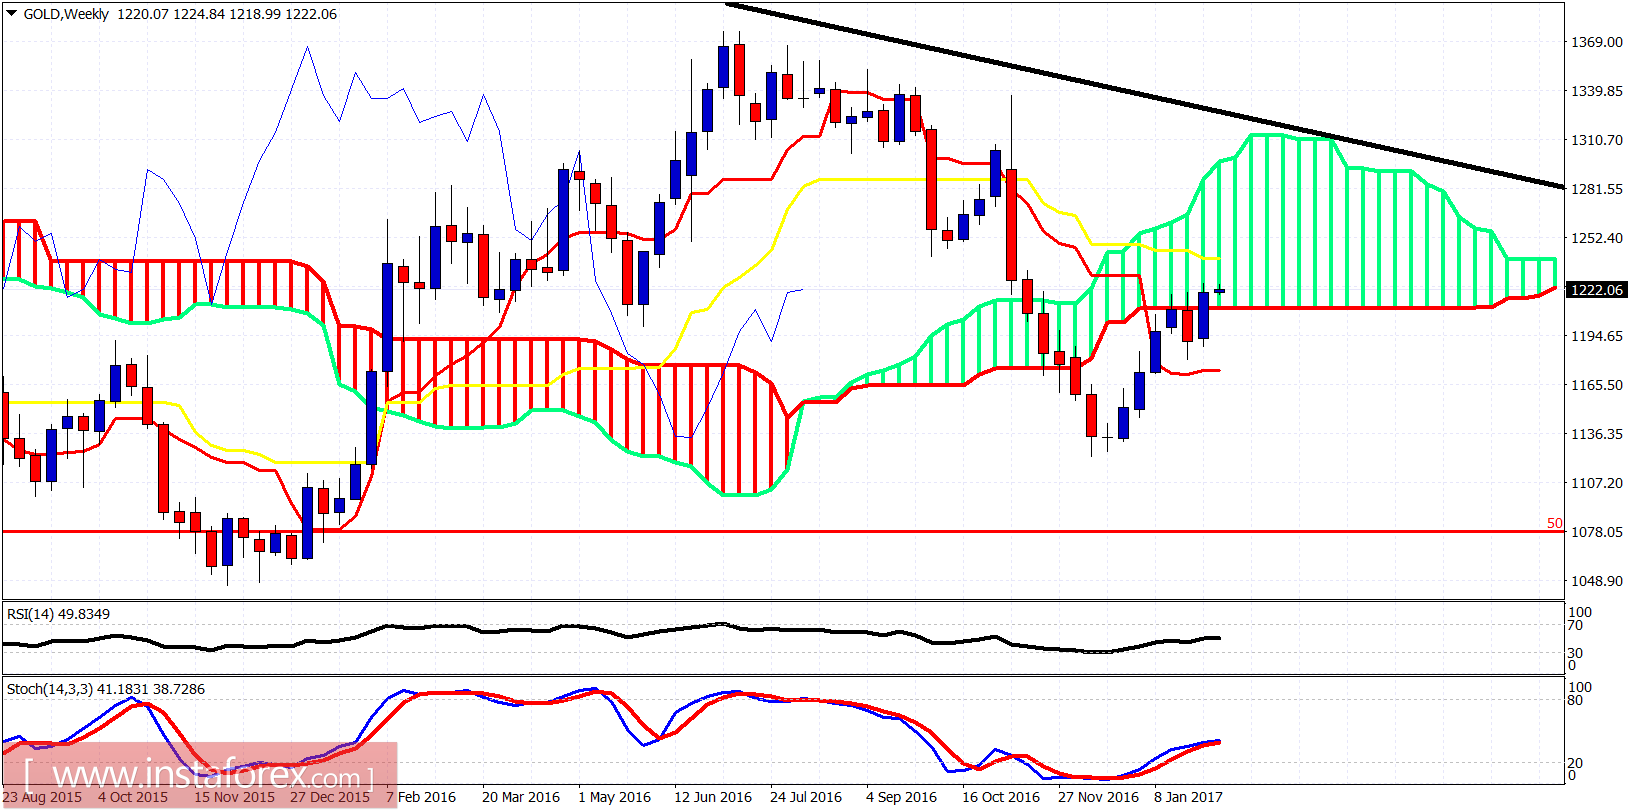
On a weekly basis the price closed inside the weekly cloud. This implies that soon we should expect a test of the kijun-sen resistance (yellow line indicator) and after that a move towards the upper cloud boundary towards $1,280-$1,300. In the long term I remain bullish.