 English
  Русский
 Bahasa Indonesia
 Bahasa Malay
 ไทย
ไทย Español
 Deutsch
 Български
 Français
 Tiếng Việt
 中文
中文 বাংলা
বাংলা हिन्दी
 Čeština
 Українська
 Română

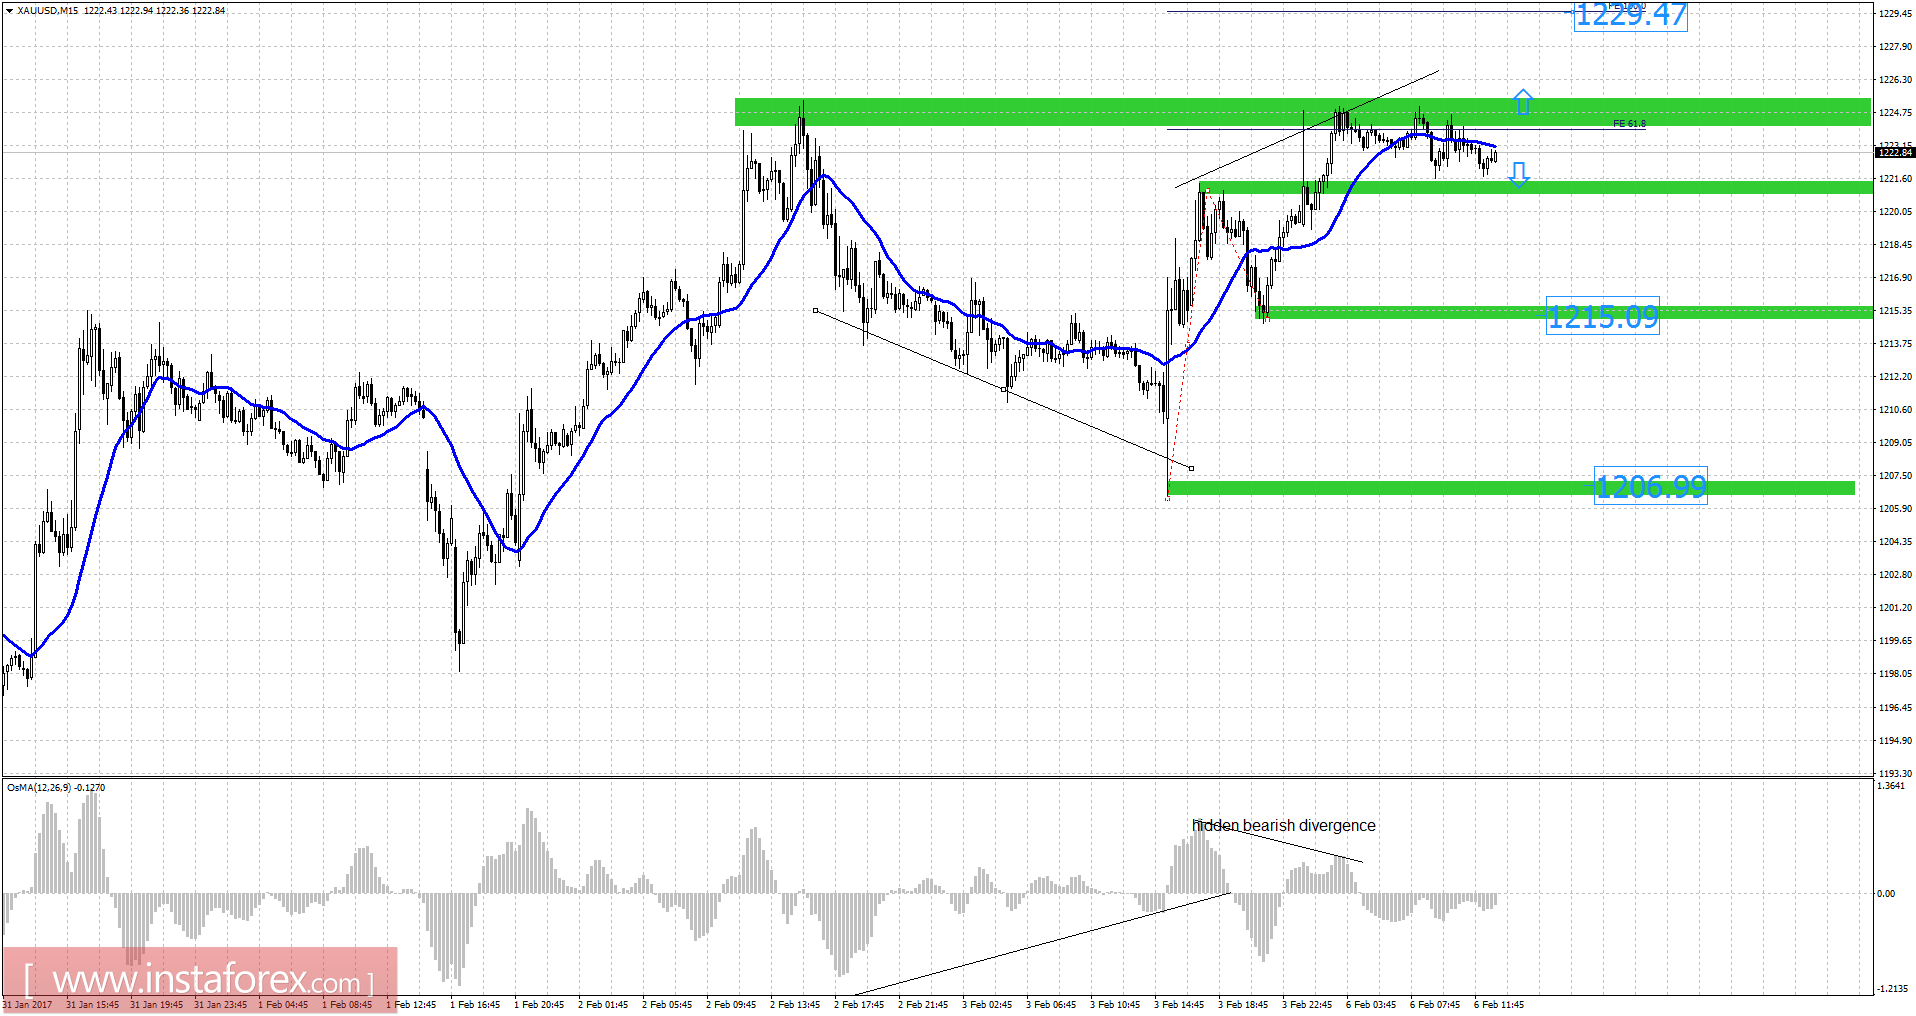
Recently, gold has been trading upwards. As I expeted, the price tested the level of $1,225.05. According to the 15M time frame, I found a hidden unconfirmed bearish divergence in the background, which is a sign of potential weakness. My advice is to watch for potential selling opportunities. Anyway, to confirm potential downward movement, I would wait that price breaks support at $1,221.50. If the price breaks the level of $1,221.50, Gold may test the level of $1,215.00. Anyway, if the price breaks the resitance at $1,225.05, gold may visit the level of $1,229.50 (Fibonacci expansion 100%). Trend is still bullish but there is bearish divergence in progres.
Fibonacci pivot points :
R1: 1,224.75
R2: 1,225.95
R3: 1,227.90
Support levels:
S1: 1,220.90
S2: 1,219.75
S3: 1,217.85
Trading recommendations for today: watch for potential selling opportunities.