 English
  Русский
 Bahasa Indonesia
 Bahasa Malay
 ไทย
ไทย Español
 Deutsch
 Български
 Français
 Tiếng Việt
 中文
中文 বাংলা
বাংলা हिन्दी
 Čeština
 Українська
 Română

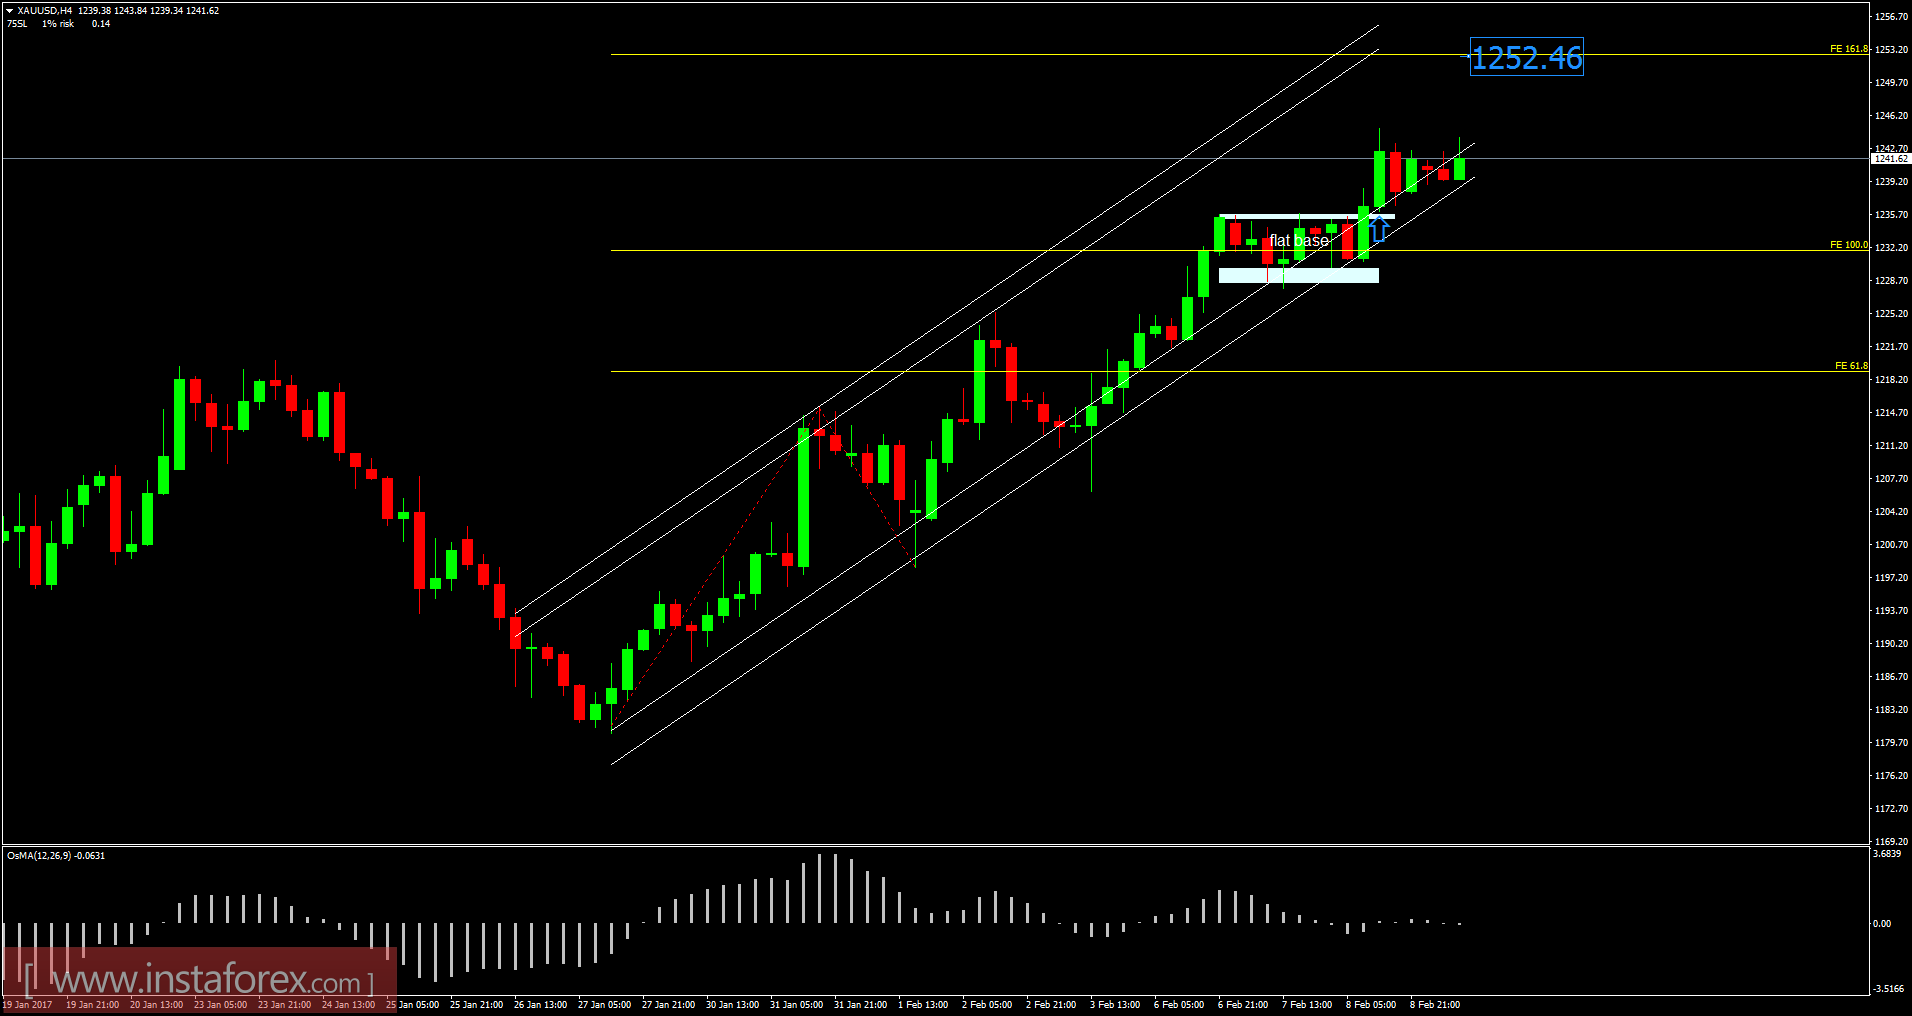
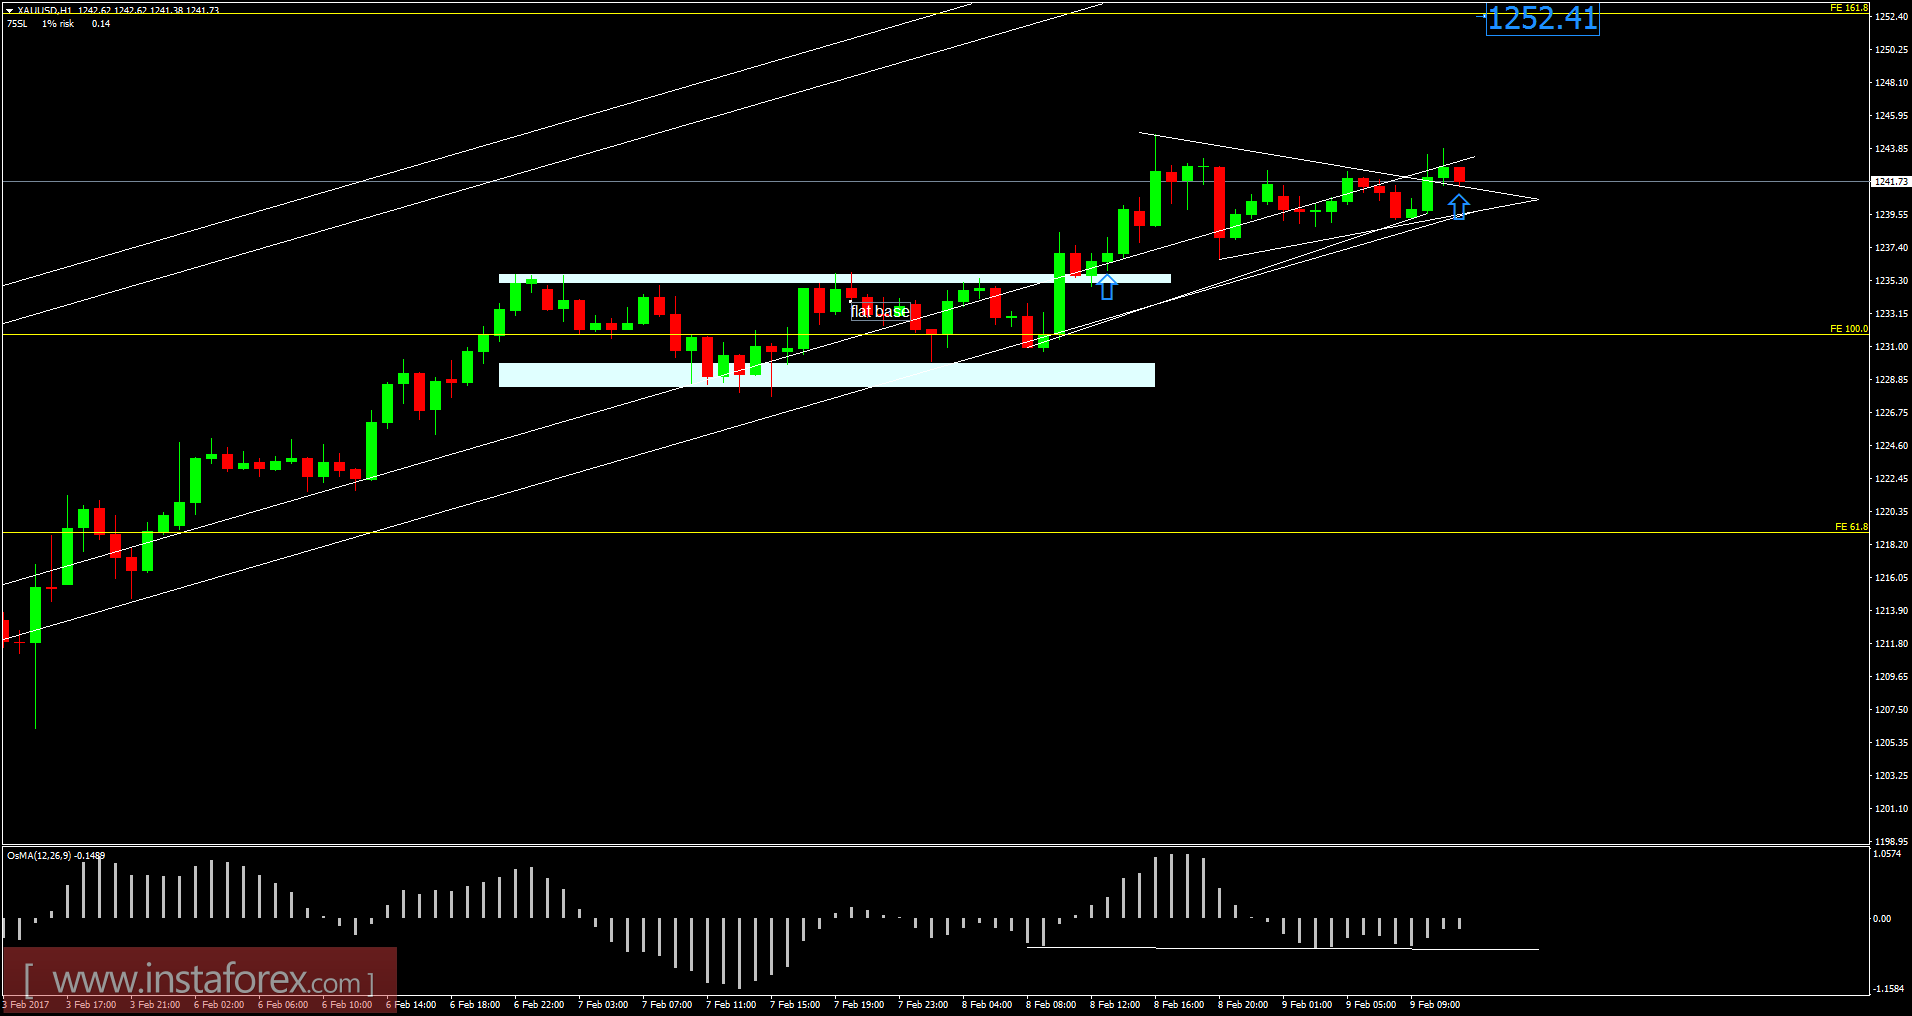
Recently, gold has been trading upwards. As I expcted, the price tested the level of $1,244.77. According to the 4H time frame, I found successful rejection from lower diagonal of upward channel. The trend is still bullish. Based on 1H time frame, I have found broken symmetrical triangle, which sign that gold may continue with upward movement. Target is set at the price of $1,252.00 (Fibonacci expansion 161.8%).
Fibonacci pivot points:
Resistance levels:
R1: 1,242.40
R2: 1,245.50
R3: 1,250.40
Support levels:
S1: 1,232.50
S2: 1,229.50
S3: 1,224.60
Trading recommendations for today: watch for potential buying opportunities.