 English
  Русский
 Bahasa Indonesia
 Bahasa Malay
 ไทย
ไทย Español
 Deutsch
 Български
 Français
 Tiếng Việt
 中文
中文 বাংলা
বাংলা हिन्दी
 Čeština
 Українська
 Română

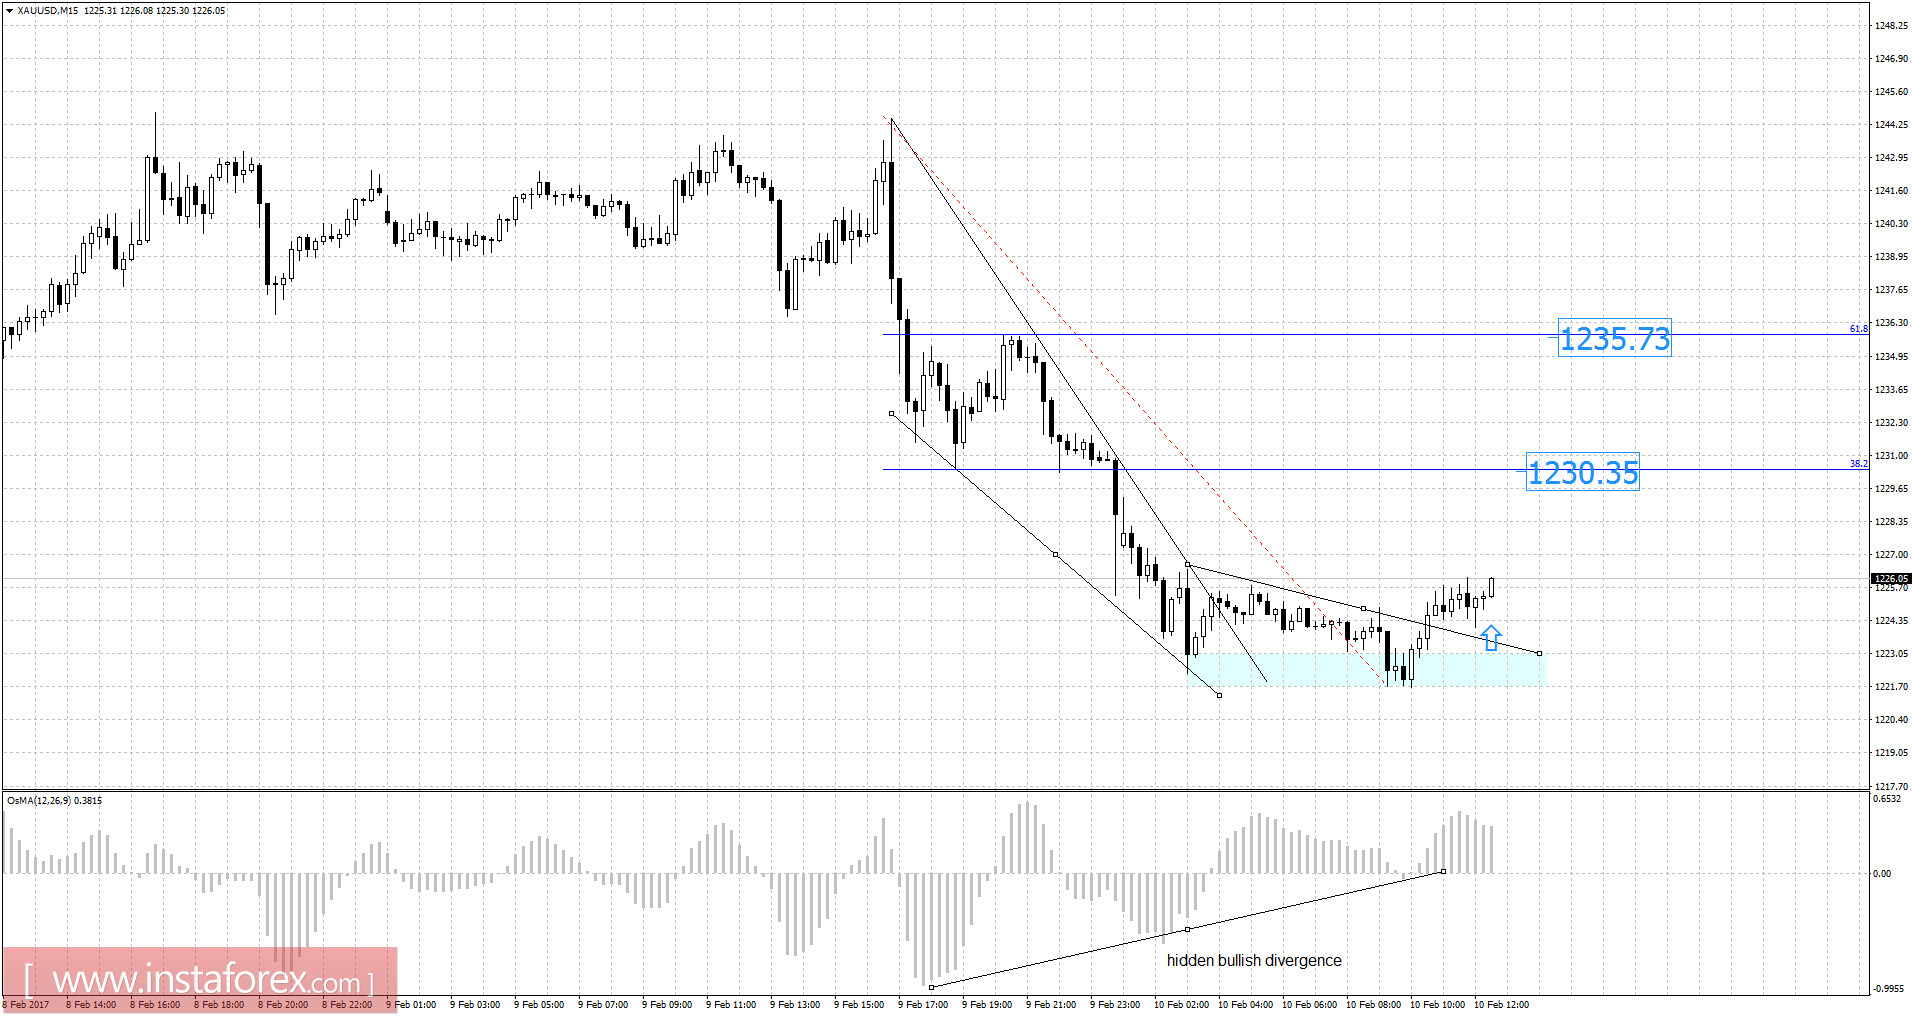
Recently, gold has been trading downwards. The price tested the level of $1,221.70. According to the 15M time frame, I found bullish hidden divergence in the progress. My advice is to watch for potential buying opportunities. There is a broken supply trendline in the background. I have placed Fibonacci retracement to find potential upward targets. I got Fibonacci retracement 38.2% at the price of $1,230.35 and Fibonacci retracement 61.8% at the price of $1,235.70.
Fibonacci pivot points:
Resistance levels:
R1: 1,241.50
R2: 1,245.50
R3: 1,251.70
Support levels:
S1: 1,228.50
S2: 1,224.90
S3: 1,218.60
Trading recommendations for today: watch for potential buying opportunities.