 English
  Русский
 Bahasa Indonesia
 Bahasa Malay
 ไทย
ไทย Español
 Deutsch
 Български
 Français
 Tiếng Việt
 中文
中文 বাংলা
বাংলা हिन्दी
 Čeština
 Українська
 Română

GBP/USD is consolidating above the support level of 1.2475, waiting for another light week in terms of macroeconomic data. The 200 SMA still is pushing the pair to the downside and it is expected to see a rebound towards 1.2561 in coming hours. However, as long as GBP/USD remains capped by the upper band of the Bollinger band, then it can test the support zone of 1.2414.
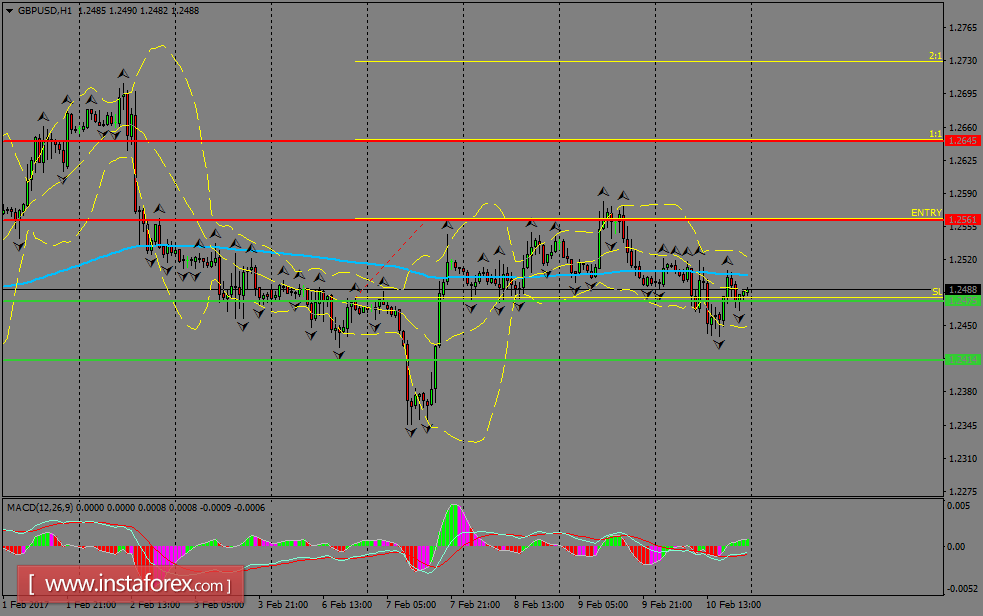
H1 chart's resistance levels: 1.2561 / 1.2645
H1 chart's support levels: 1.2475 / 1.2414
Trading recommendations for today: Based on the H1 chart, buy (long) orders only if the GBP/USD pair breaks a bullish candlestick; the resistance level is at 1.2561, take profit is at 1.2645 and stop loss is at 1.2480.