 English
  Русский
 Bahasa Indonesia
 Bahasa Malay
 ไทย
ไทย Español
 Deutsch
 Български
 Français
 Tiếng Việt
 中文
中文 বাংলা
বাংলা हिन्दी
 Čeština
 Українська
 Română

The Dollar index made a big bounce up last week towards the important resistance of 101. The price is still inside a bearish channel but there are also a lot of chances that the recent low at 99.24 is an important medium- to long-term low.
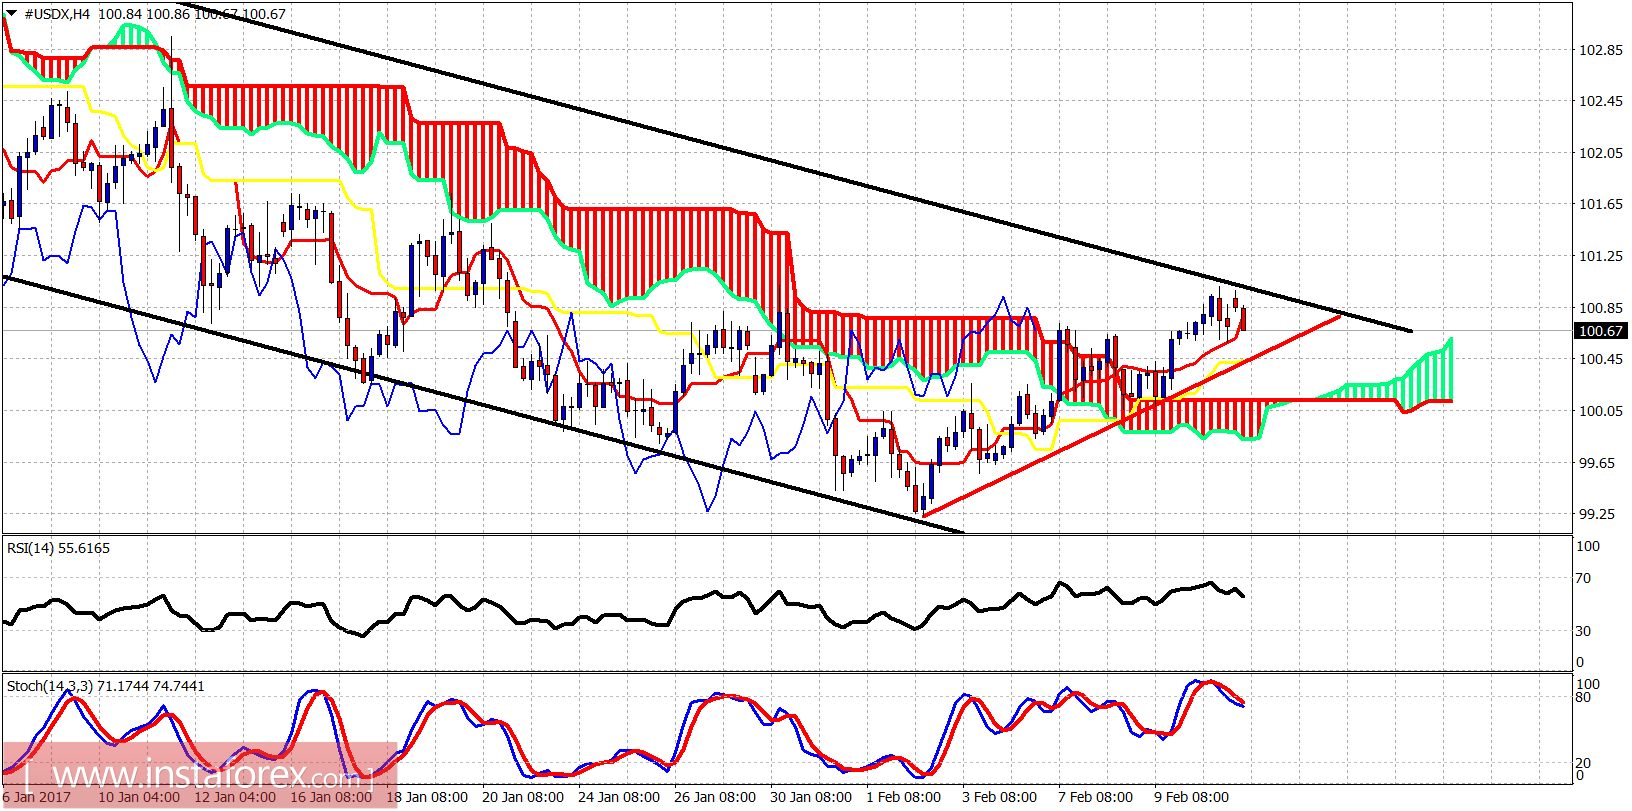
Black line - bearish channel
The Dollar index is pulling back off channel resistance. Short-term support is at 100.45. If it is broken, I would expect the price to fall towards cloud support at 100. There are short-term bearish divergence signals. A pullback is justified. This expected pullback is very critical to the medium-term trend. Why? Because if a higher low is made, it will be a great opportunity to go long for the Dollar as the bigger picture suggests a new bullish trend could start from this area targeting 105 and higher.
Red line - bearish divergence
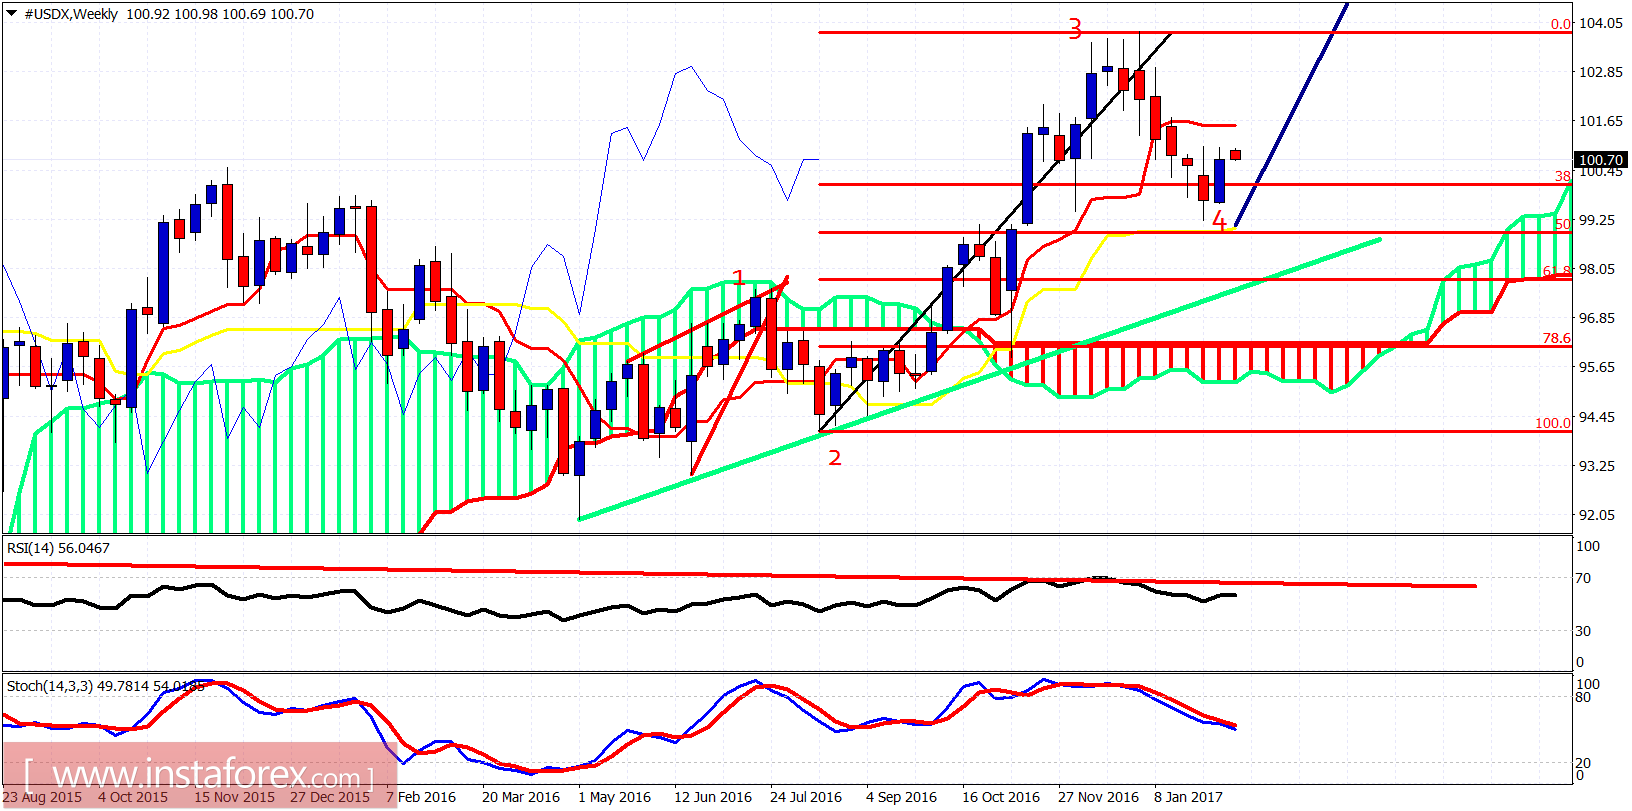
The Dollar index is bouncing on a weekly basis off the 50% Fibonacci retracement and the kijun-sen (yellow line indicator). As long as we trade above last week's low, the bulls will be in control and we would be expecting a move to new highs. A break below last week's low will push the price towards the long-term green trendline support.