 English
  Русский
 Bahasa Indonesia
 Bahasa Malay
 ไทย
ไทย Español
 Deutsch
 Български
 Français
 Tiếng Việt
 中文
中文 বাংলা
বাংলা हिन्दी
 Čeština
 Українська
 Română

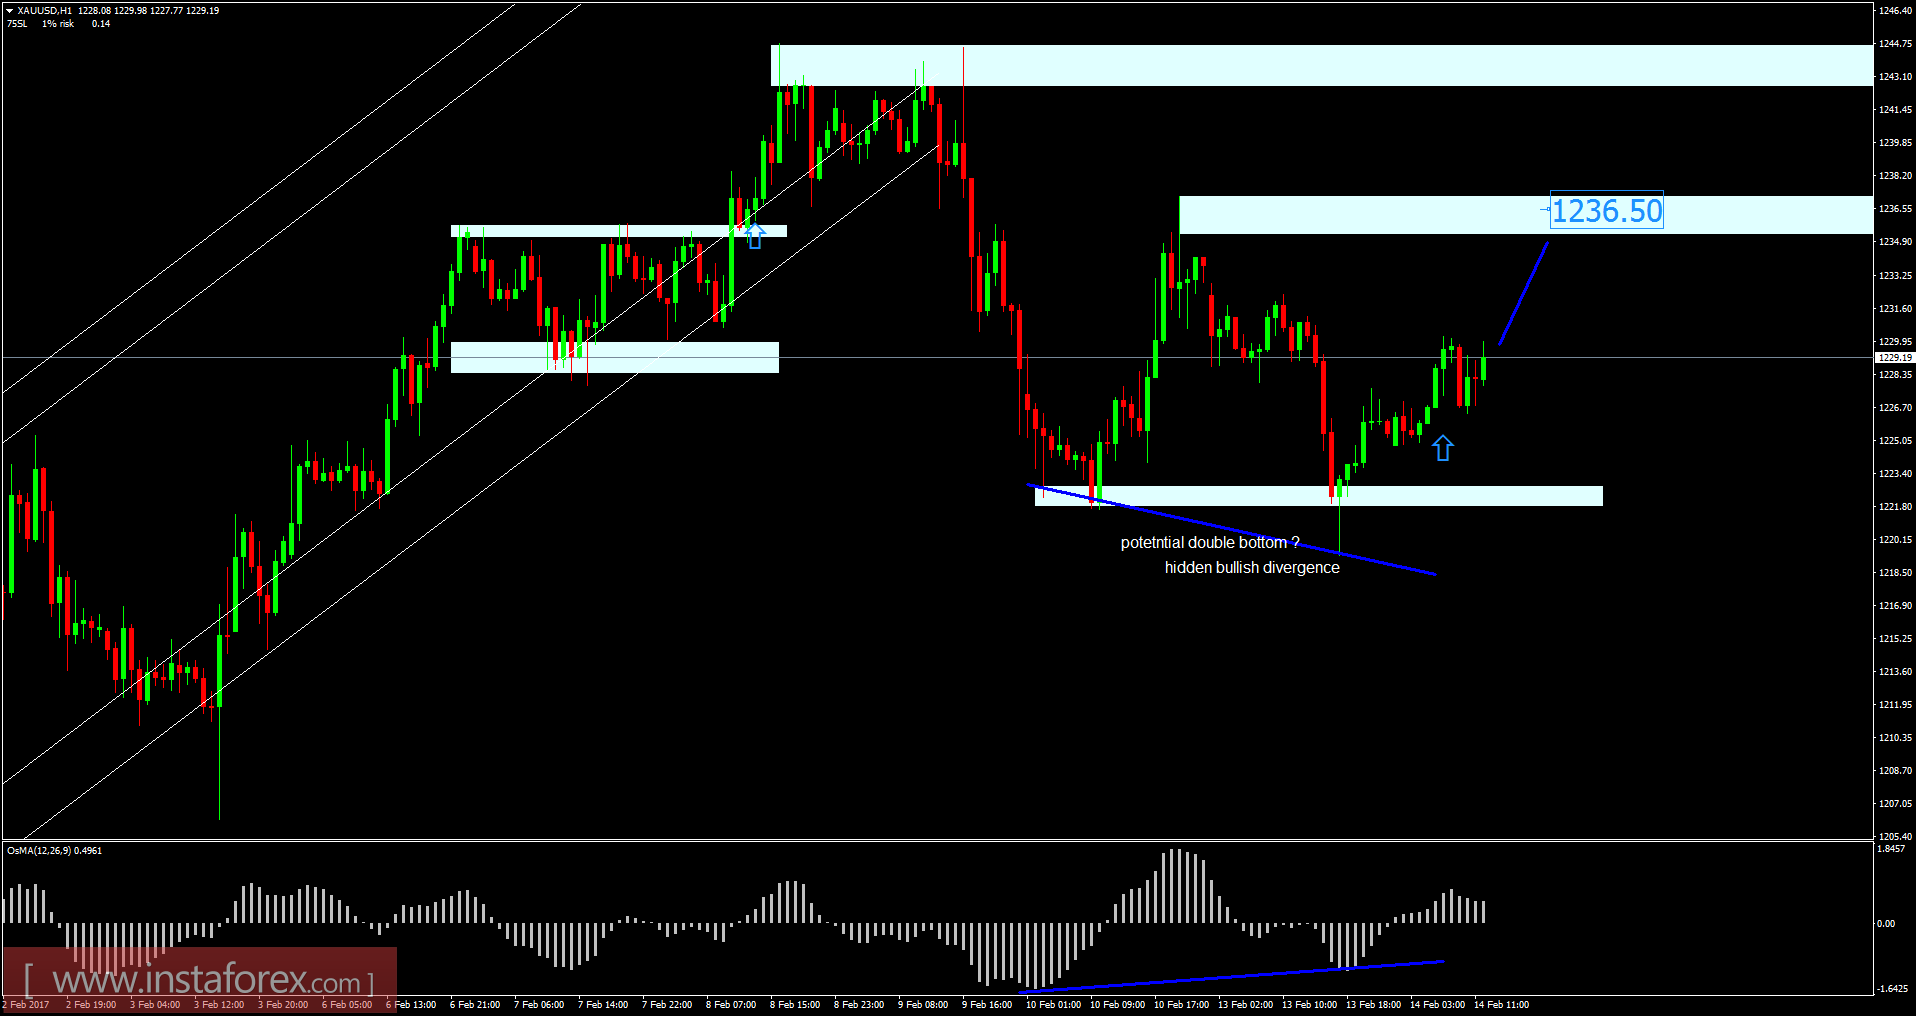
Recently, gold has been trading downwards. As I expected, the price tested the level of $1,221.32. Anyway, according to the 1H time frame, I found hidden bullish divergence in creation on the moving average oscilator. There is also a potential double bottom formation. My advice is to watch for potetnial buying positions. The first target is set at the price of $1,236.50. If the price breaks the level of $1,237.00, It will confirm double bottom formation and bullish divergence.
Fibonacci pivot points:
Resistance levels:
R1: 1,229.45
R2: 1,232.30
R3: 1,236.90
Support levels:
S1: 1,220.50
S2: 1,217.45
S3: 1,212.75
Trading recommendations for today: watch for potential buying opportunities.