 English
  Русский
 Bahasa Indonesia
 Bahasa Malay
 ไทย
ไทย Español
 Deutsch
 Български
 Français
 Tiếng Việt
 中文
中文 বাংলা
বাংলা हिन्दी
 Čeština
 Українська
 Română

GBP/USD plummeted to consolidate once again below the 1.2500 zone and now, we're seeing some choppy price action around the 1.2450 level. If the pair manages to break above 1.2500, then we can expect further rallies to test the resistance zone of 1.2561. However, that move should be taken as bears' giving up in a temporal way.
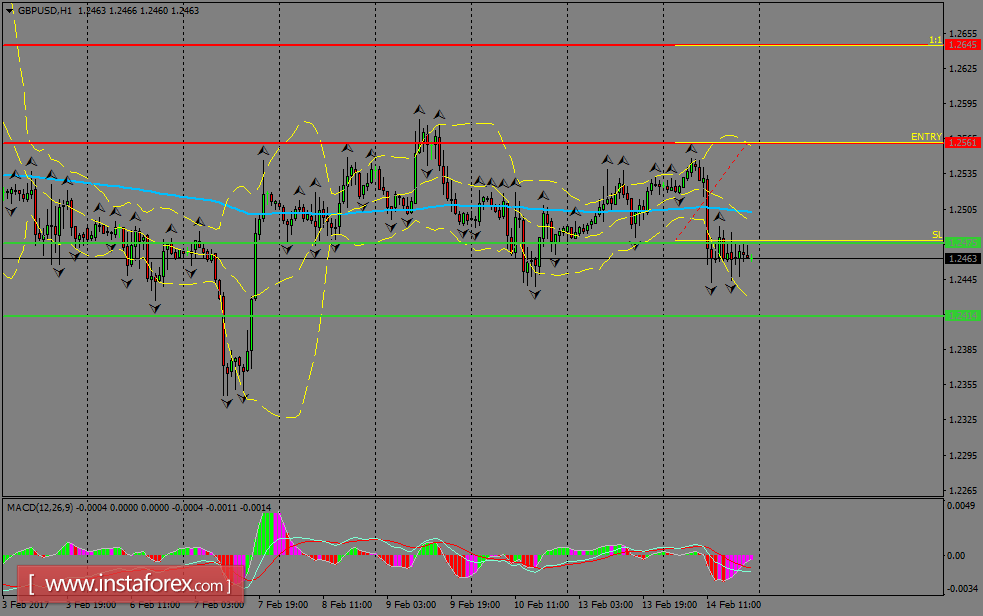
H1 chart's resistance levels: 1.2561 / 1.2645
H1 chart's support levels: 1.2475 / 1.2414
Trading recommendations for today: Based on the H1 chart, buy (long) orders only if the GBP/USD pair breaks a bullish candlestick; the resistance level is at 1.2561, take profit is at 1.2645 and stop loss is at 1.2480.