 English
  Русский
 Bahasa Indonesia
 Bahasa Malay
 ไทย
ไทย Español
 Deutsch
 Български
 Français
 Tiếng Việt
 中文
中文 বাংলা
বাংলা हिन्दी
 Čeština
 Українська
 Română

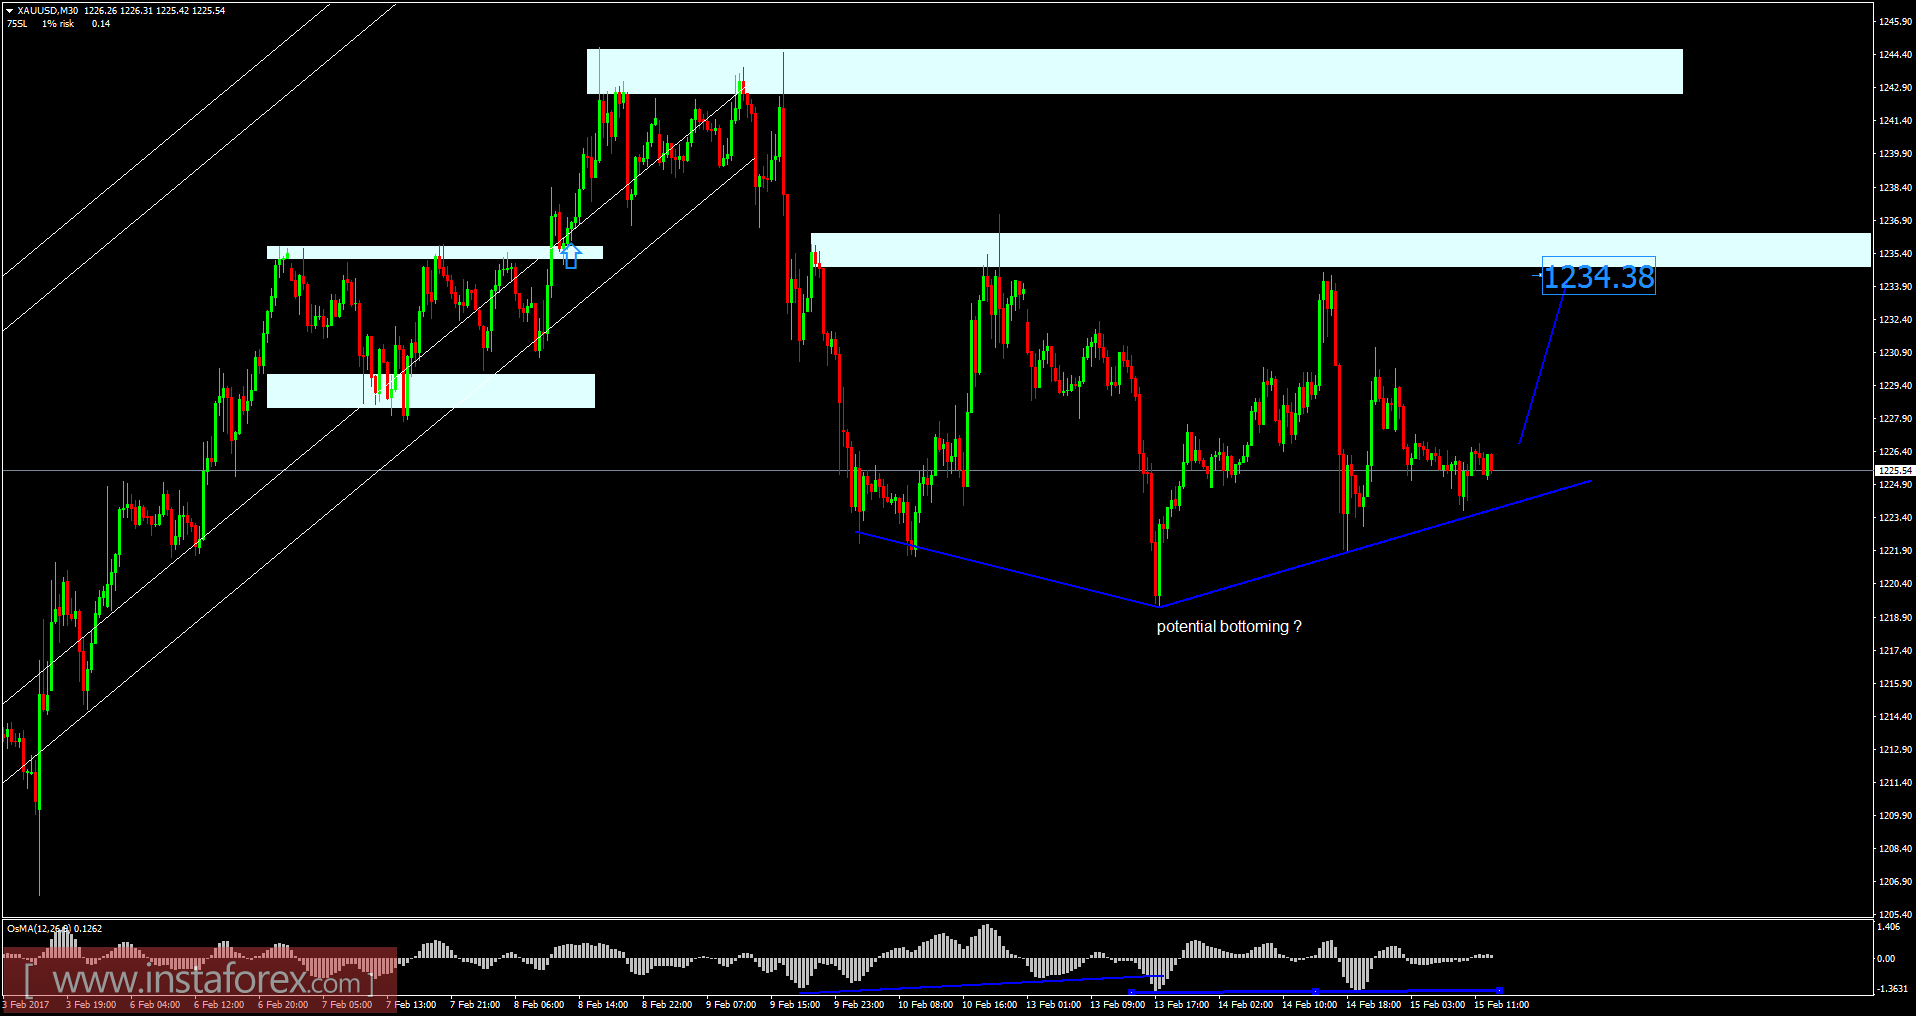
Recently, gold has been trading sideways at the price of $1,225.50. According to the 30M time frame, I found hidden bullish divergence in creation on the moving average oscillator, which is a sign that sellers lost power. I found potential parabolic bottom formation, which is a very strong type of bottoming. My advice is to watch for potential buying opportunities. Targets are set at the price of $1,234.50 and $1,244.00.
Fibonacci pivot points:
Resistance levels:
R1: 1,230.85
R2: 1,233.50
R3: 1,237.90
Support levels:
S1: 1,222.10
S2: 1,219.45
S3: 1,215.75
Trading recommendations for today: watch for potential buying opportunities.