 English
  Русский
 Bahasa Indonesia
 Bahasa Malay
 ไทย
ไทย Español
 Deutsch
 Български
 Français
 Tiếng Việt
 中文
中文 বাংলা
বাংলা हिन्दी
 Čeština
 Українська
 Română

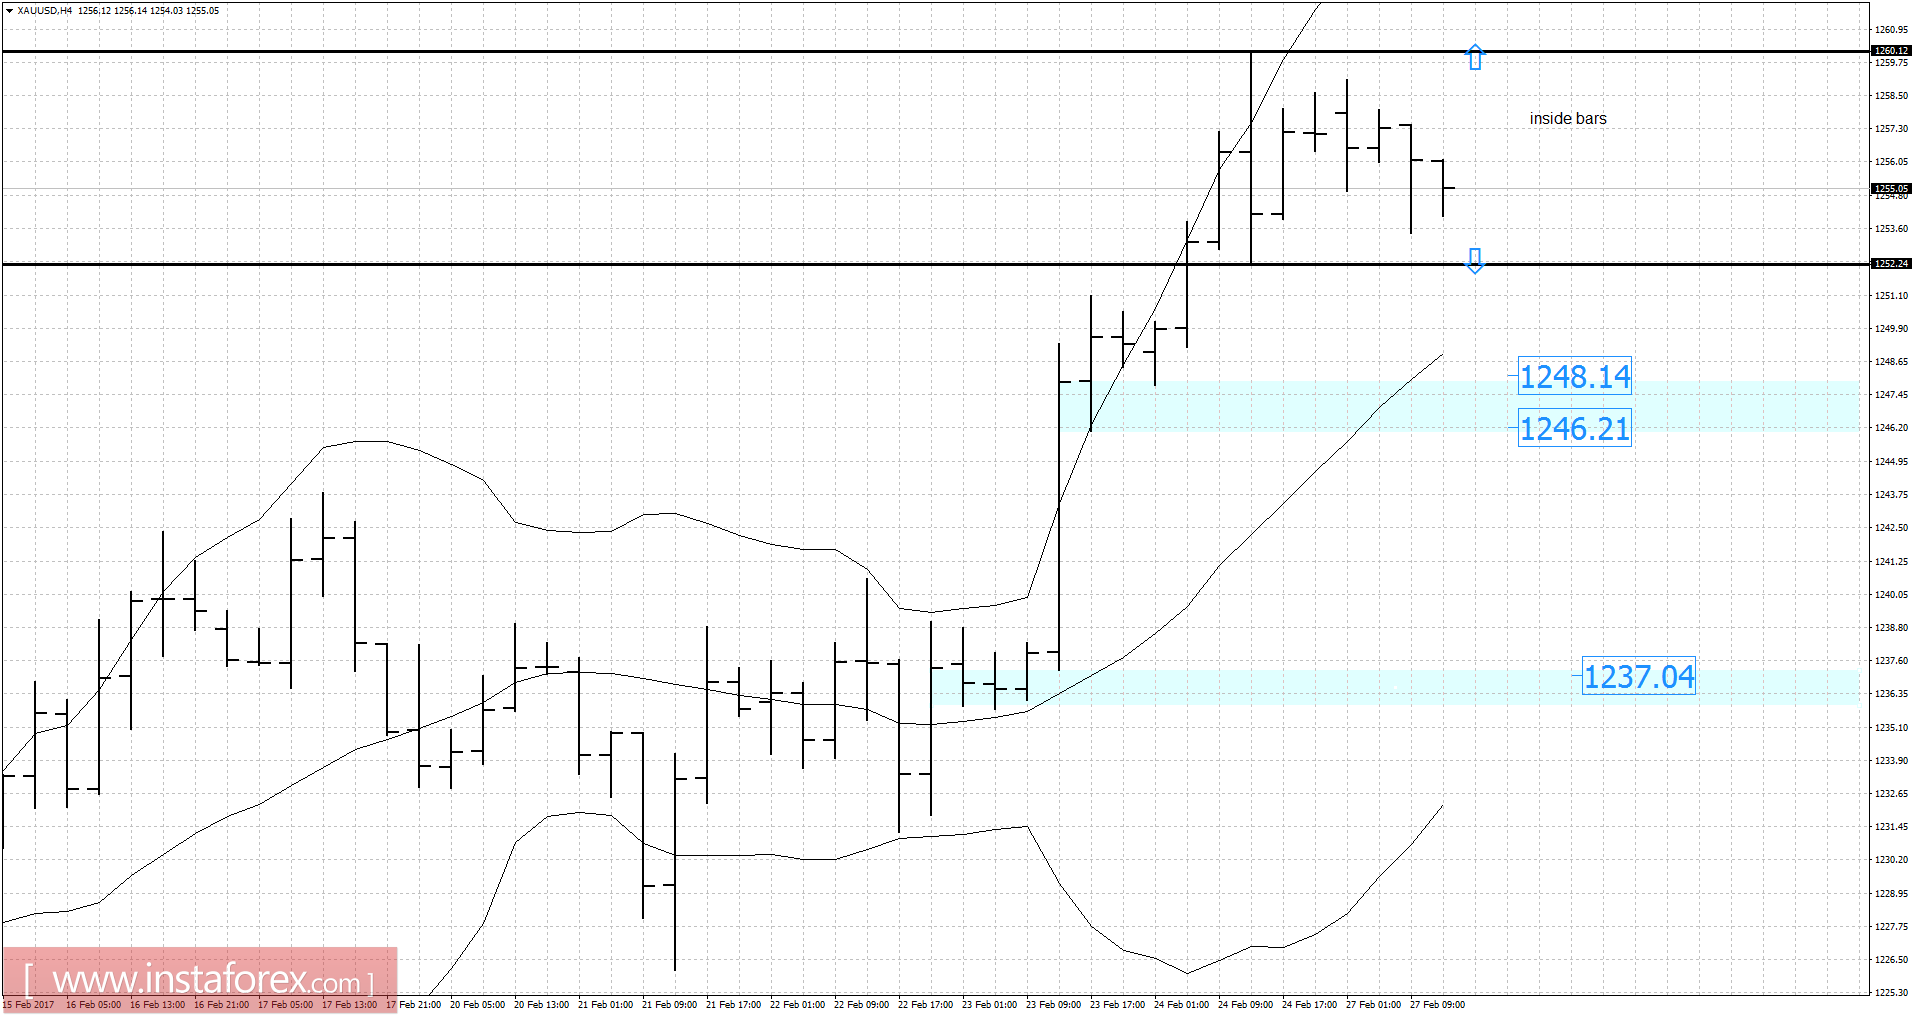
Recently, gold has been trading sideways at the price of $1,254.70. According to the 4H time frame, I found inside bars formation, which is a sign of indecision. The price is trading in range between the price of $1,260.00 (resistance) and the price of $1,252.30 (support). Watch for breakout of support or resistance to confirm further direction. Downward targets are set at the price of $1,248.00, $1,246.20, and $1,237.00. The upward target is set at the price of $1,268.00.
Resistance levels:
R1: $1,258.00
R2: $1,258.80
R3: $1,259.90
Support levels:
S1: $1,255.70
S2: $1,255.00
S3: $1,253.90
Trading recommendations for today: watch for breakout of support or resistance to confirm further direction.