 English
  Русский
 Bahasa Indonesia
 Bahasa Malay
 ไทย
ไทย Español
 Deutsch
 Български
 Français
 Tiếng Việt
 中文
中文 বাংলা
বাংলা हिन्दी
 Čeština
 Українська
 Română

Gold pulled back yesterday, as we explained in our last post, towards the breakout area of $1,245 for a back test. This is a justified move and does not change our medium-term bullish plans. Our targets remain $1,280-$1,320. For the bullish scenario to play out, Gold needs to reverse from current levels.
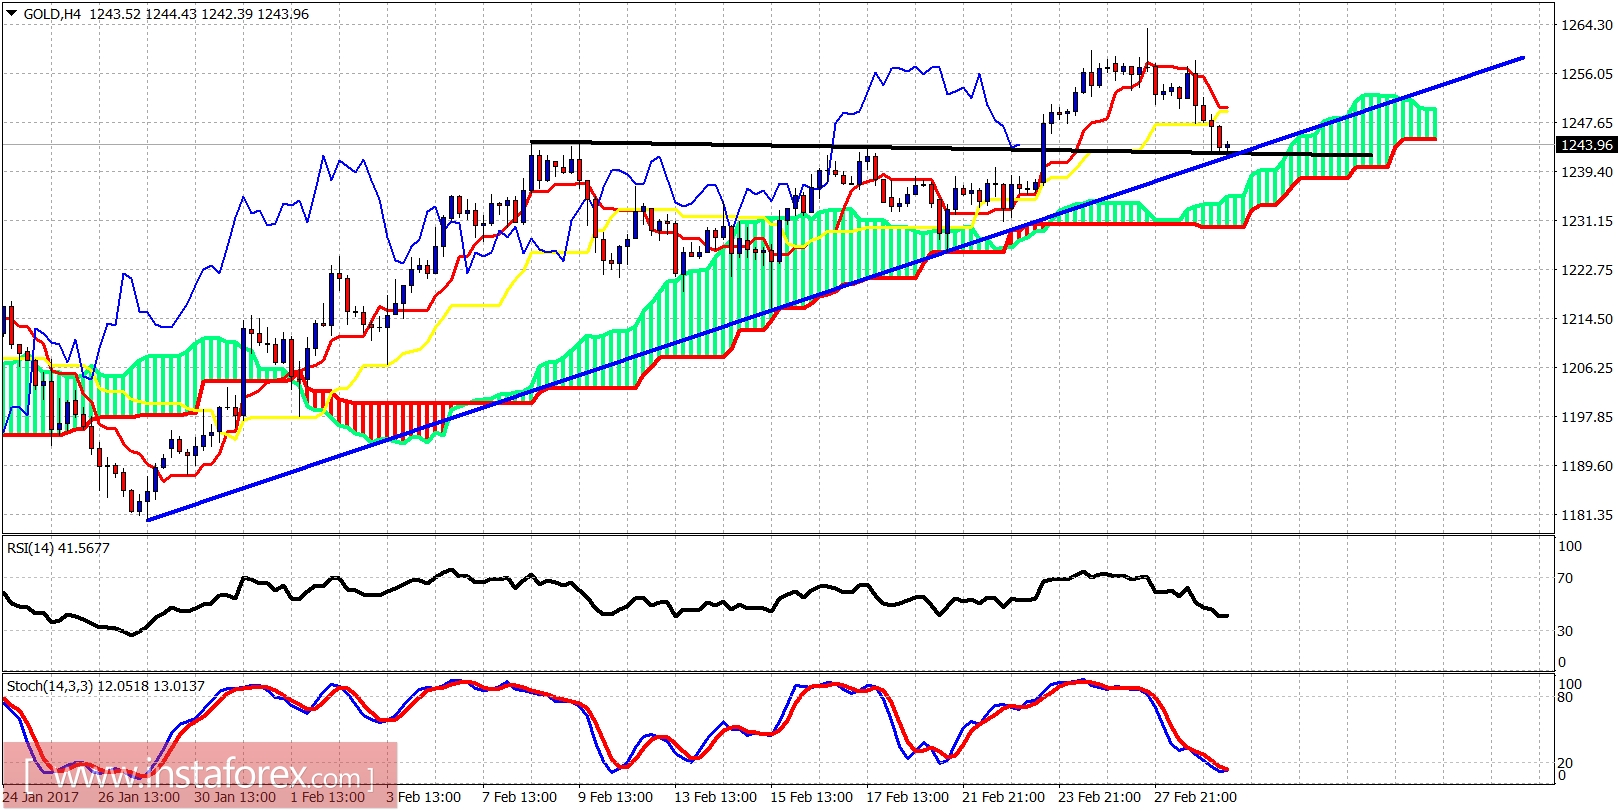
Blue line - support
The price is trading above the Ichimoku cloud and above the blue trend line support. The price has reached the break out area of $1,245 and I expect to see an upward reversal from the current levels. Support below $1,245 is found at $1,231. Resistance is at $1,250 and the next is at $1,257.
Black line - long-term resistance trend line
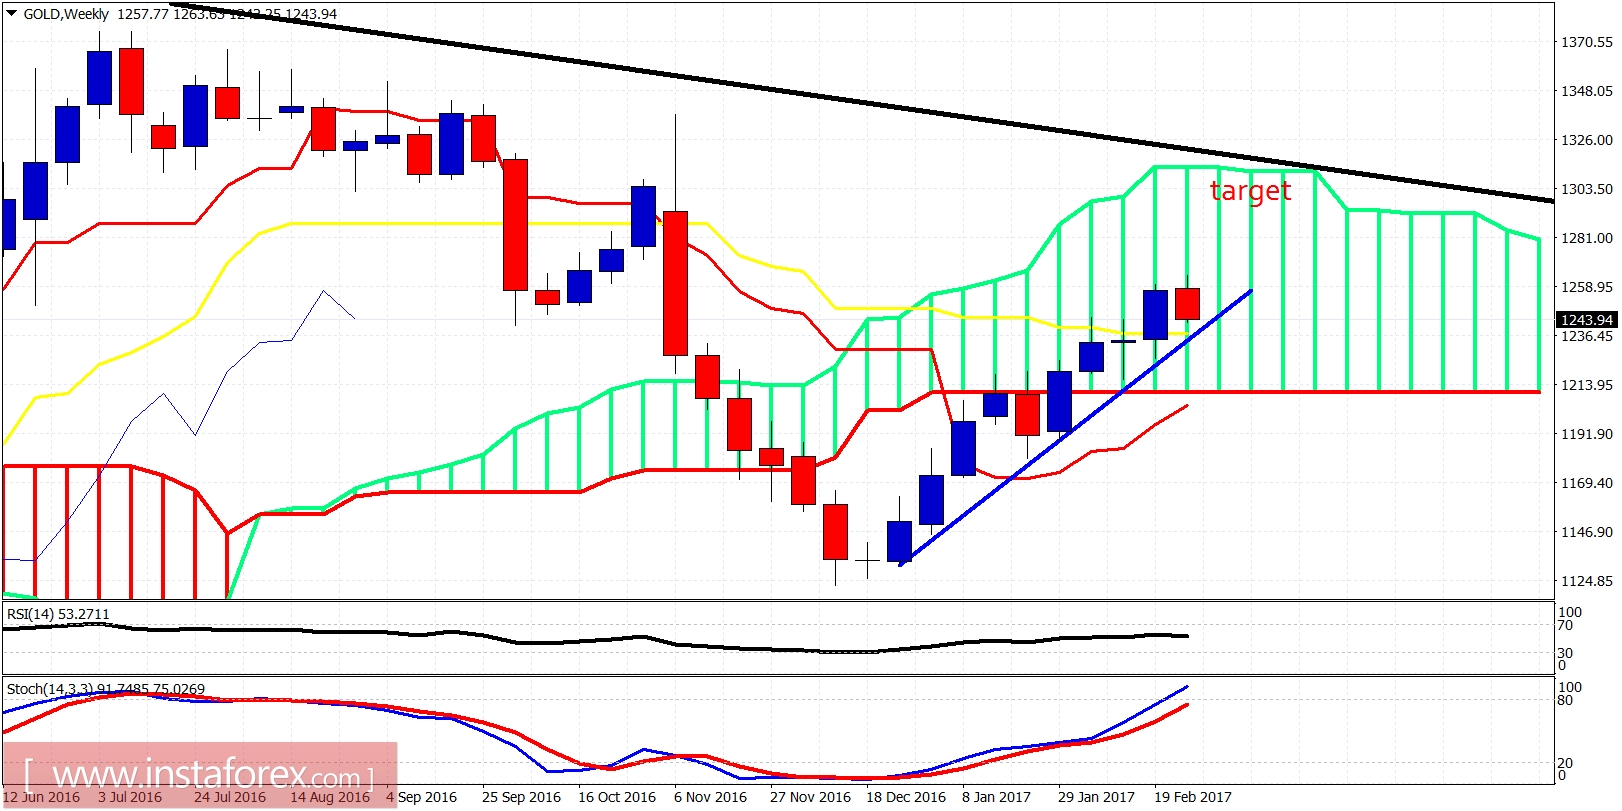
Despite the negative start in the week for Gold, I expect the week to end higher as I believe we may already have seen the weekly lows. I continue to expect Gold to reach $1,280-$1,320. I remain bullish.