 English
  Русский
 Bahasa Indonesia
 Bahasa Malay
 ไทย
ไทย Español
 Deutsch
 Български
 Français
 Tiếng Việt
 中文
中文 বাংলা
বাংলা हिन्दी
 Čeština
 Українська
 Română

The pair is currently testing the support zone of 1.2280, where a breakout is likely to happen in order to reach the 1.2100 handle across the board. So far, the Cable has consolidated it's structure in the near-term below the 200 SMA at H1 chart and such move should deliver more weakness. In the case of a corrective move, GBP/USD can test the 1.2400 psychological level.
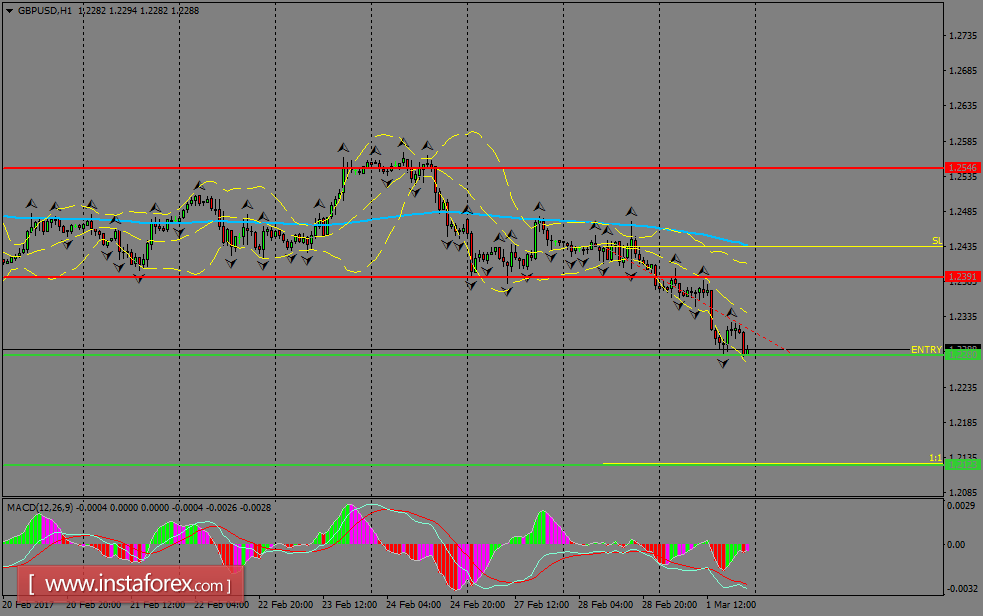
H1 chart's resistance levels: 1.2391 / 1.2546
H1 chart's support levels: 1.2280 / 1.2123
Trading recommendations for today: Based on the H1 chart, sell (short) orders only if the GBP/USD pair breaks a bearish candlestick; the support level is at 1.2280, take profit is at 1.2123 and stop loss is at 1.2434.