 English
  Русский
 Bahasa Indonesia
 Bahasa Malay
 ไทย
ไทย Español
 Deutsch
 Български
 Français
 Tiếng Việt
 中文
中文 বাংলা
বাংলা हिन्दी
 Čeština
 Українська
 Română

The Dollar index got rejected at the 102 area as we expected. The price pulled back towards 101.30. Support between 101.25 and 101 is very important for the continuation of the uptrend. A break below it will put 99.25 low to the test, as the Head and Shoulders pattern will have increased its chances of success.
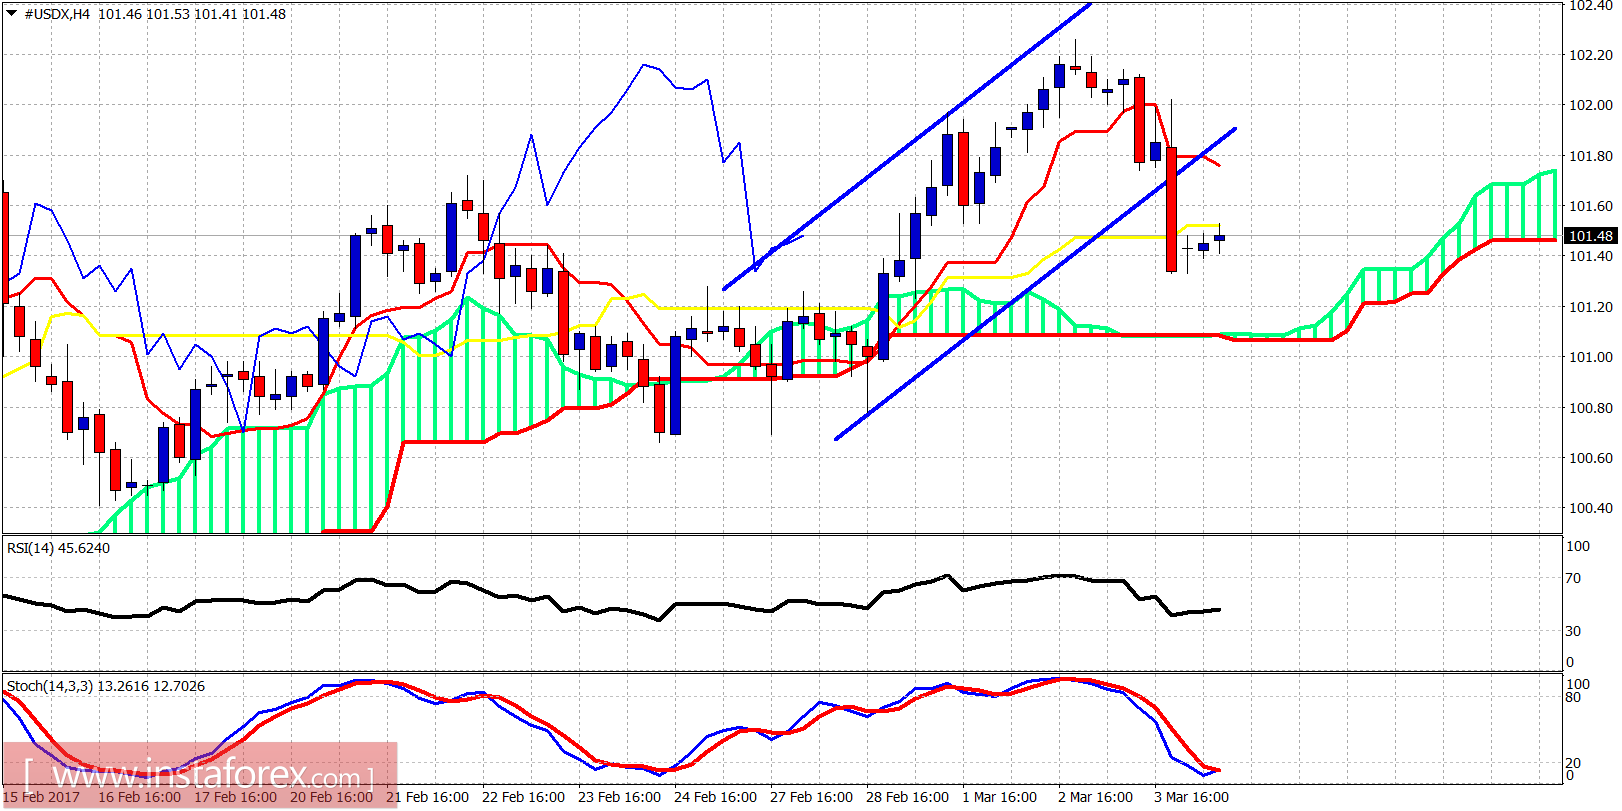
The Dollar index has short-term support at 101.25-101. We could test that area of support today. Resistance is at 101.80. The bulls now need a higher low, as the pullback we expected from last week, materialized fast on Friday.
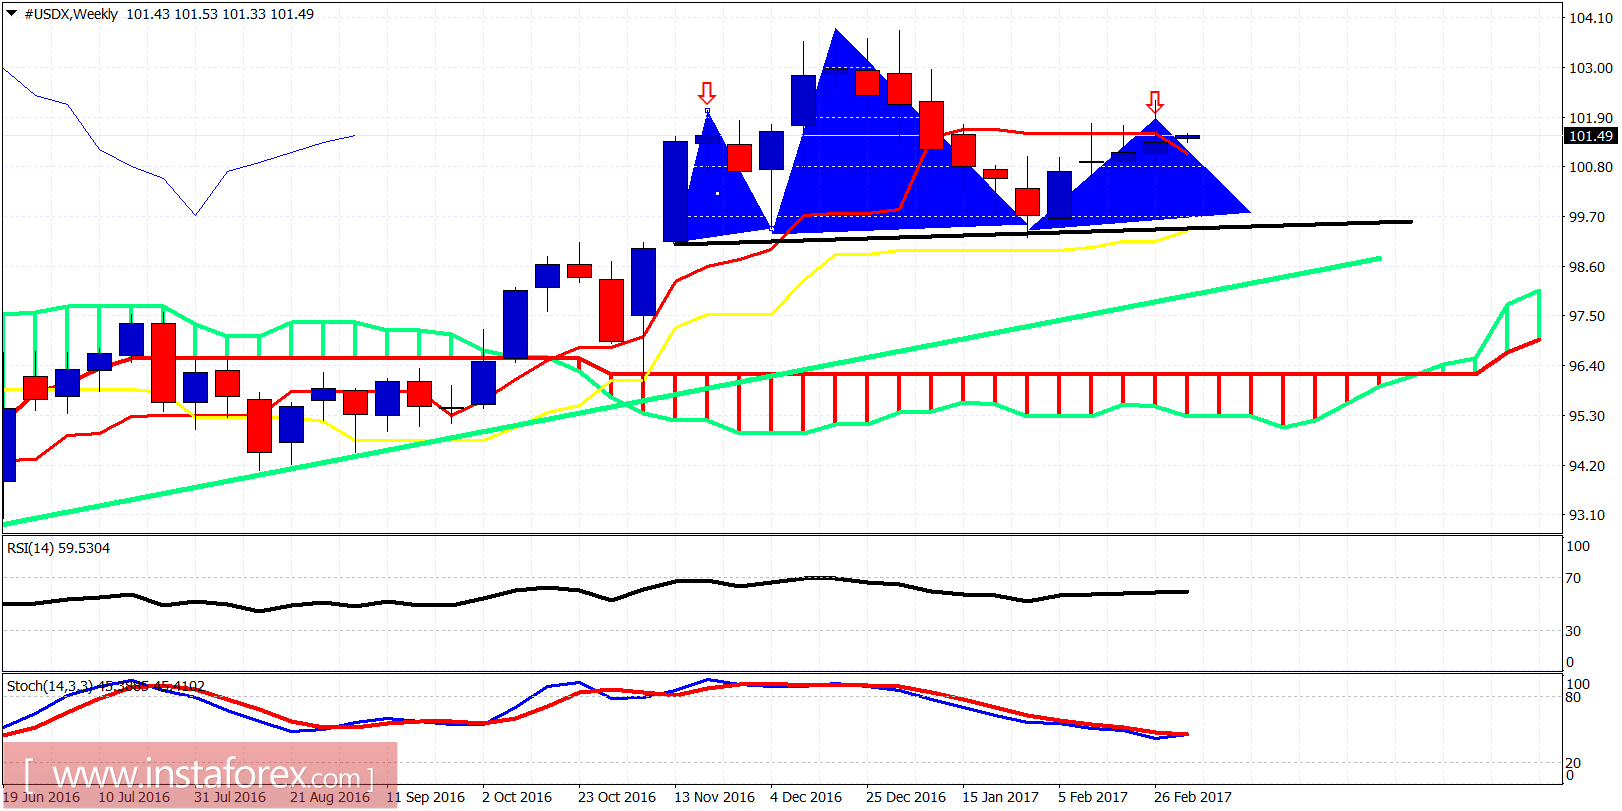
Green line - long-term support trend line
Blue areas - Head and Shoulder pattern
The Dollar index reached the same levels as the left hand shoulder and got rejected. We are at very important junction. As I pointed out last week, at 102 I preferred to be bearish as the overbought short-term conditions favored the pullback. The weekly oscillators however show me that we could have more downside pressures in Dollar, especially as we close in the FOMC date and the ECB meeting.