 English
  Русский
 Bahasa Indonesia
 Bahasa Malay
 ไทย
ไทย Español
 Deutsch
 Български
 Français
 Tiếng Việt
 中文
中文 বাংলা
বাংলা हिन्दी
 Čeština
 Українська
 Română

The index is still in a battle to consolidate above the 200 SMA at H1 chart and such a move could deliver more bulls' force towards 102.39, where a breakout above that area should produce a rally to test the 103.40 level. Furthermore, if USDX manages to stay above the 103.00 level during the rest of the week, then we can target the psychological zone of 105.00. 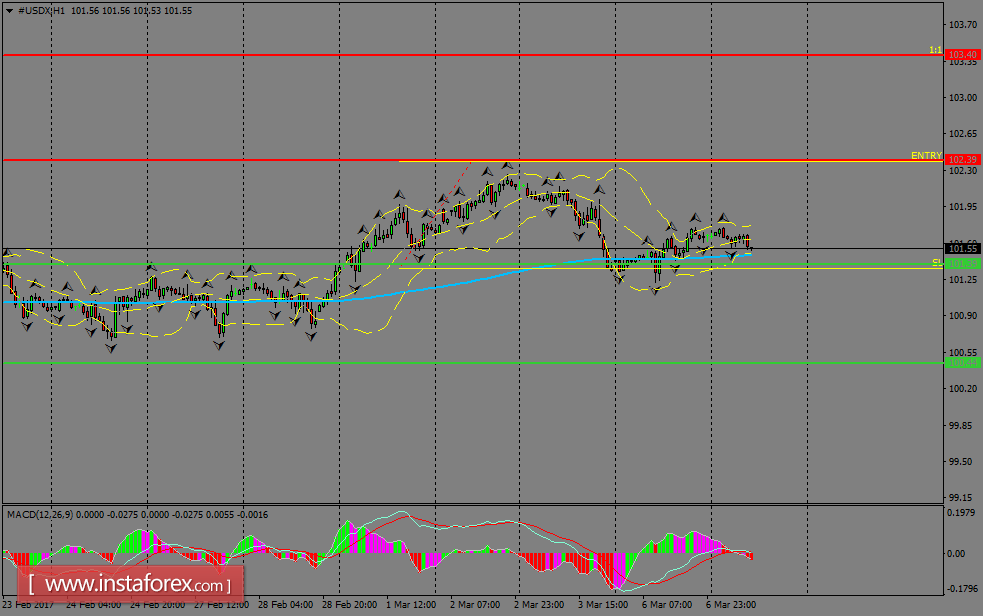
H1 chart's resistance levels: 102.39 / 103.40 H1 chart's support levels: 101.39 / 100.44 Trading recommendations for today: Based on the H1 chart, place buy (long) orders only if the USD Index breaks with a bullish candlestick; the resistance level is at 102.39, take profit is at 103.40, and stop loss is at 101.35.