 English
  Русский
 Bahasa Indonesia
 Bahasa Malay
 ไทย
ไทย Español
 Deutsch
 Български
 Français
 Tiếng Việt
 中文
中文 বাংলা
বাংলা हिन्दी
 Čeština
 Українська
 Română

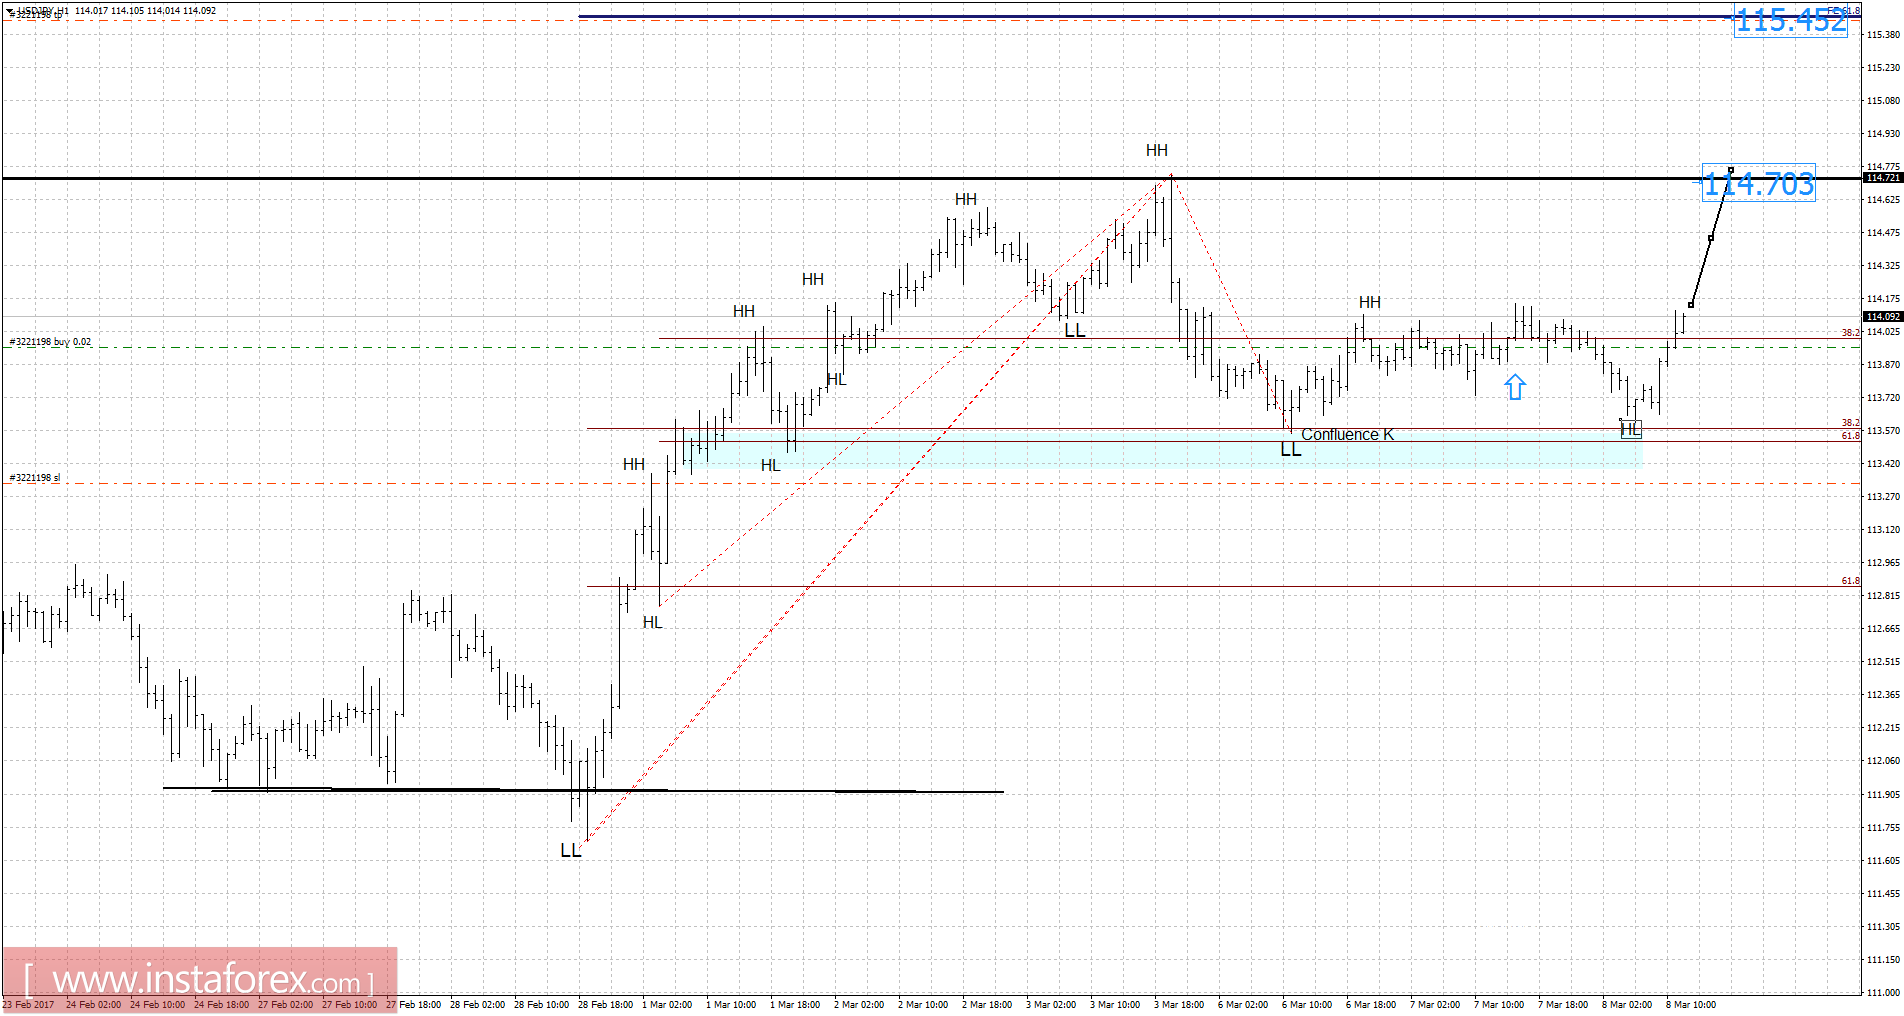
Recently, the USD/JPY pair has been trading sideways at the price of 114.10. According to the 1H time frame, I found another successful rejection of the Fibonacci confluence at the price of 113.60, which is a sign that selling looks risky. My advice is to watch for potential buying opportunities. Targets are set at the price of 114.70 (swing high) and the price of 115.45 (Fibonacci expansion 61.8%).
Resistance levels:
R1: 114.12
R2: 114.25
R3: 114.40
Support levels:
S1: 113.75
S2: 113.65
S3: 113.50
Trading recommendations for today: watch for potential buying opportunities.