 English
  Русский
 Bahasa Indonesia
 Bahasa Malay
 ไทย
ไทย Español
 Deutsch
 Български
 Français
 Tiếng Việt
 中文
中文 বাংলা
বাংলা हिन्दी
 Čeština
 Українська
 Română

The pair is doing a bearish consolidation below the 1.22 handle, as the support zone of 1.2123 continues to be a strong area where buyers can help to lift GBP/USD in order to resume the uptrend toward the 200 SMA at H1 chart. However, as long as the pair stays below that moving average and very close to the Bollinger band, it can target the 1.2034 level.
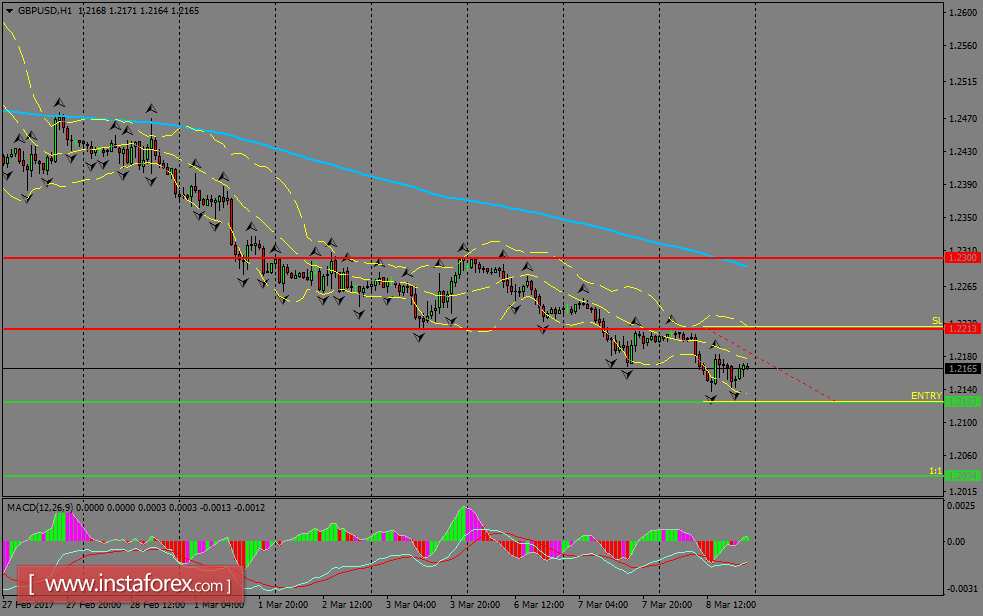
H1 chart's resistance levels: 1.2300 / 1.2400
H1 chart's support levels: 1.2123 / 1.2034
Trading recommendations for today: Based on the H1 chart, sell (short) orders only if the GBP/USD pair breaks a bearish candlestick; the support level is at 1.2123, take profit is at 1.2034 and stop loss is at 1.2216.