 English
  Русский
 Bahasa Indonesia
 Bahasa Malay
 ไทย
ไทย Español
 Deutsch
 Български
 Français
 Tiếng Việt
 中文
中文 বাংলা
বাংলা हिन्दी
 Čeština
 Українська
 Română

Gold price remains inside the bearish channel and in the bearish short-term trend. The deeper than expected pullback has not changed my longer-term bullish view on Gold. I continue to expect to see Gold above $1,400 over the coming months in 2017.
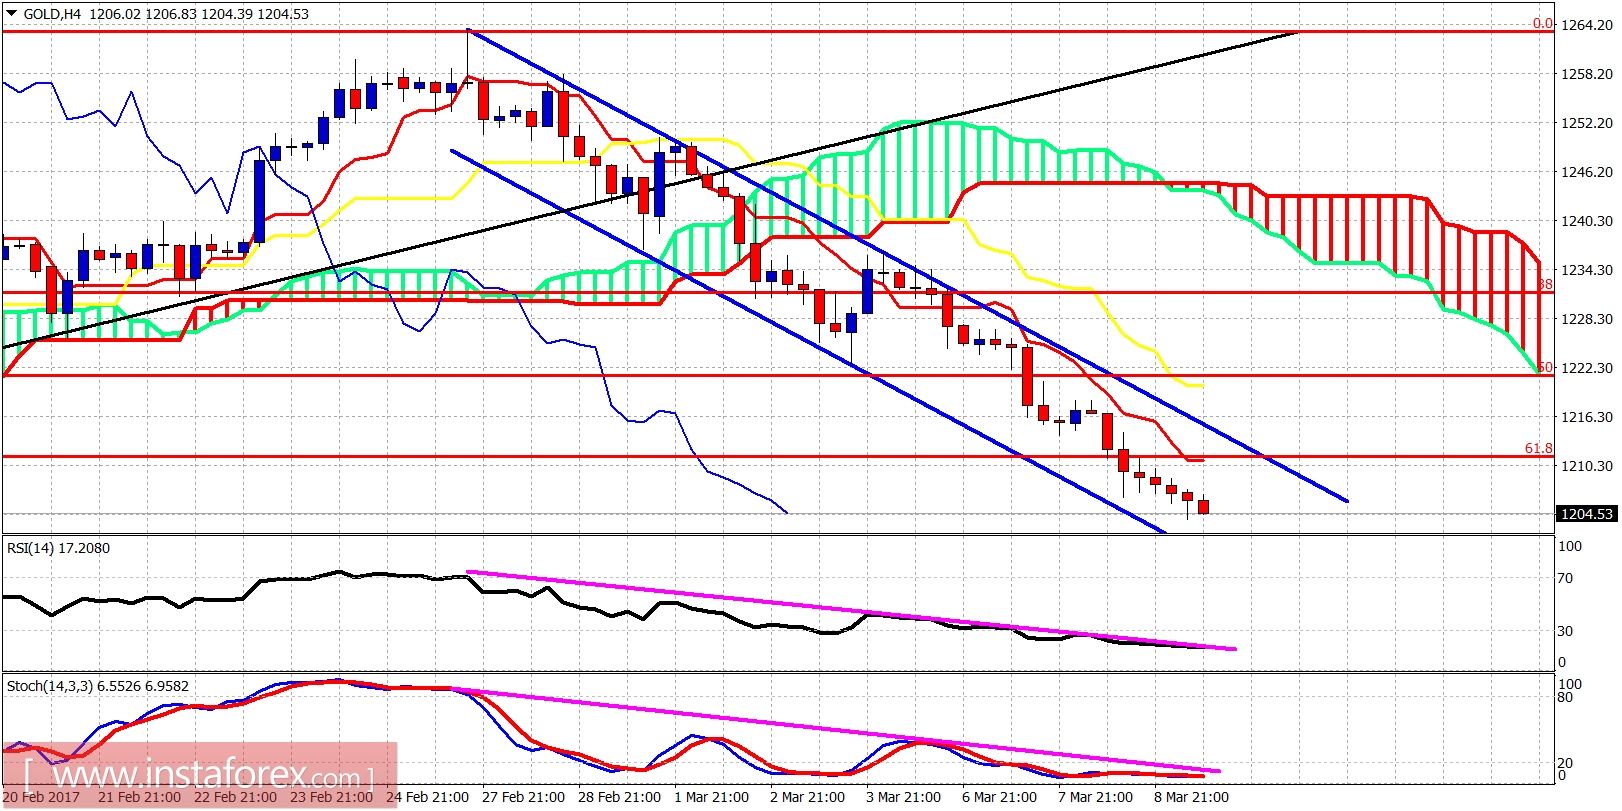
Purple lines - resistance lines
The short-term trend is bearish. Resistance is at $1,211 and the next is at $1,215. Bigger resistance is at $1,220 and cloud resistance at $1,240. Trend changes to bullish above $1,240. Watch closely the oscillators. A break above the purple trend line resistance will be a bullish short-term reversal sign.
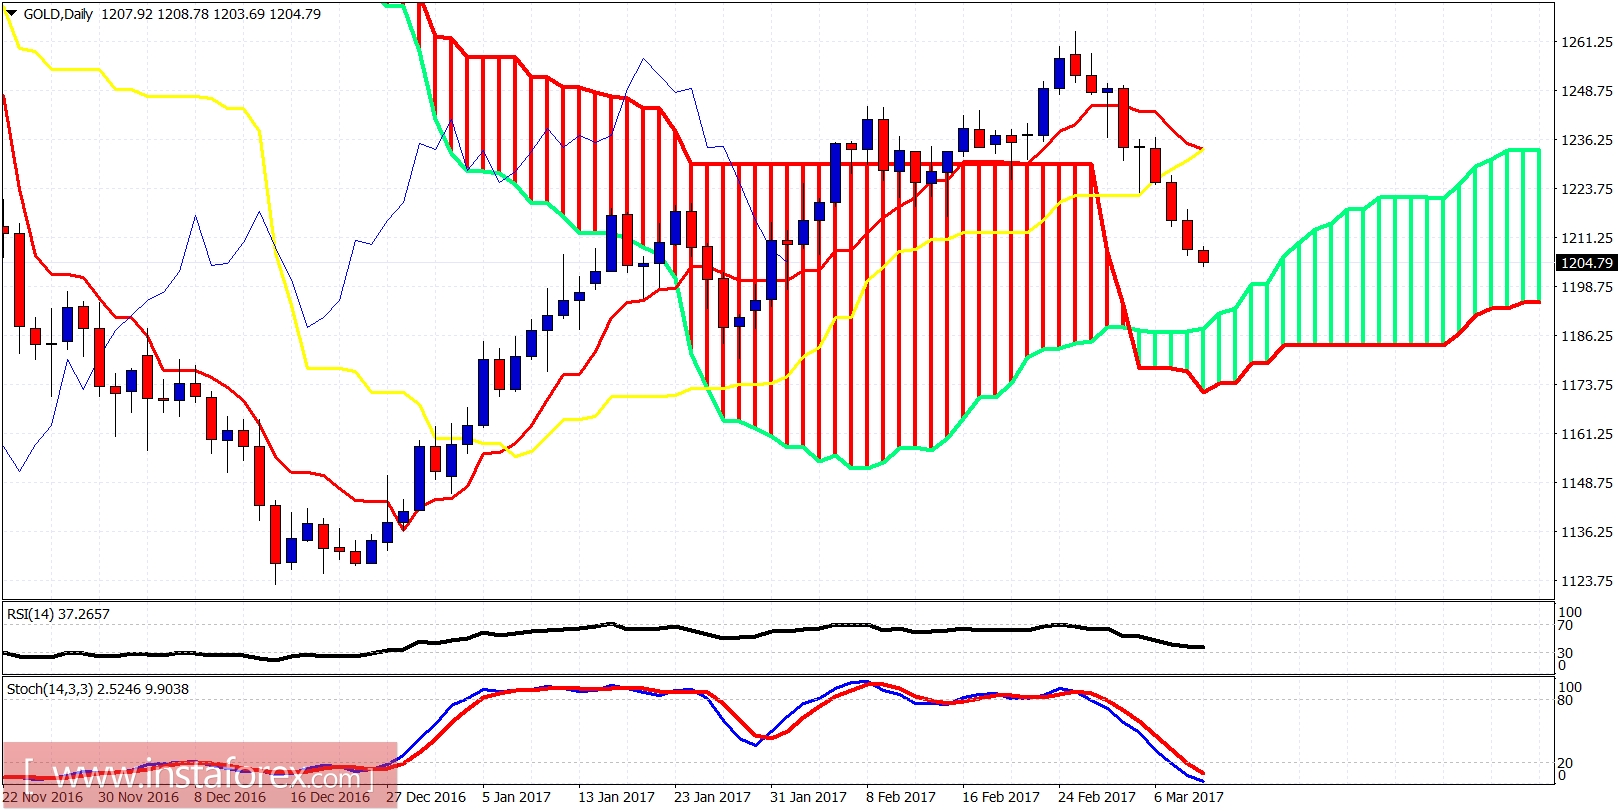
Stochastic oscillator is oversold in the Daily chart. The price is approaching daily cloud support at $1,190. Daily trend change will be confirmed only on a break above $1,236 on a daily close. This pullback in Gold is of similar importance to the pullback from $1,375 to $1,120. This pullback should produce a higher low and a new upward reversal.