 English
  Русский
 Bahasa Indonesia
 Bahasa Malay
 ไทย
ไทย Español
 Deutsch
 Български
 Français
 Tiếng Việt
 中文
中文 বাংলা
বাংলা हिन्दी
 Čeština
 Українська
 Română

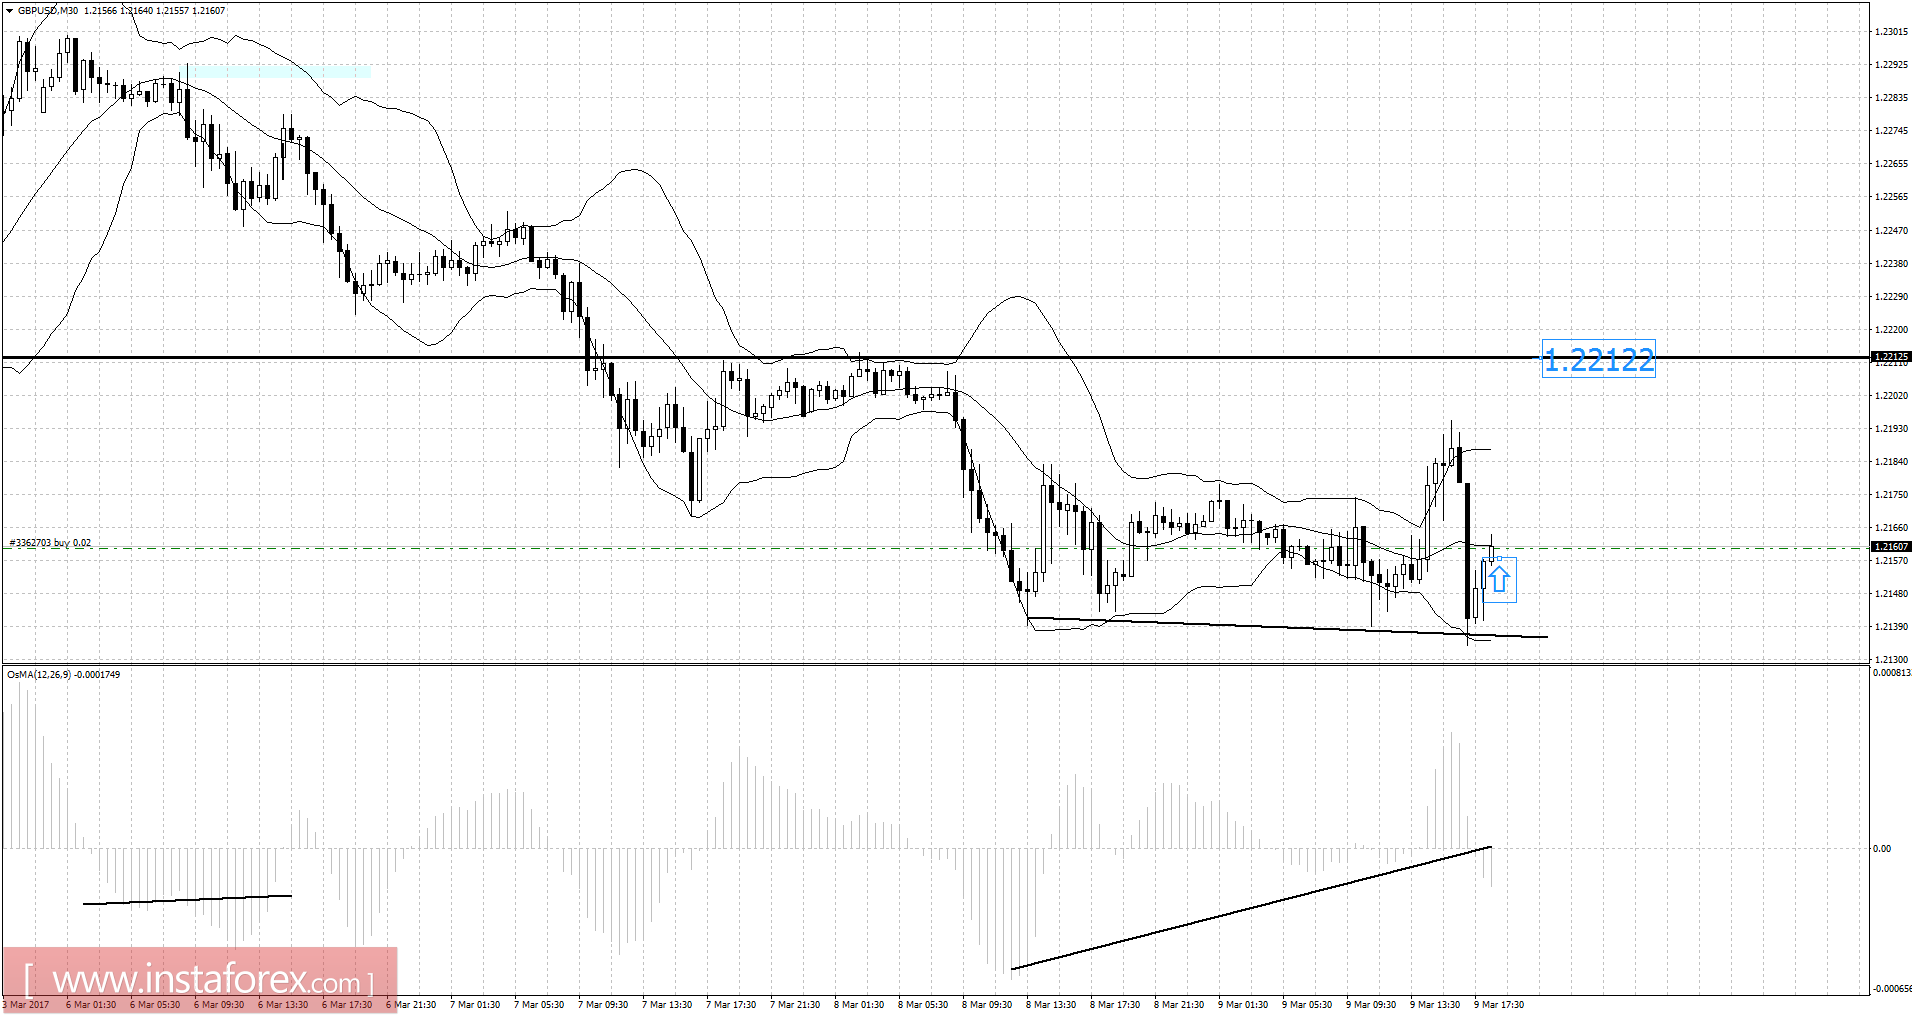
Recently, the GBP/USD pair has been trading sideways at the price of 1.2160. According to the 30M time frame, I found hidden bullish divergence, which is a sign that selling looks risky. My advice is to watch for potential buying opportunities. The first target is set at the price of 1.2220 (swing high). Support at the price of 1.2140 was held successfully several times, which is another sign of strength.
Resistance levels:
R1: 1.2212
R2: 1.2250
R3: 1.2290
Support levels:
S1: 1.2134
S2: 1.2100
S3: 1.2050
Trading recommendations for today: watch for potential buying opportunities.