 English
  Русский
 Bahasa Indonesia
 Bahasa Malay
 ไทย
ไทย Español
 Deutsch
 Български
 Français
 Tiếng Việt
 中文
中文 বাংলা
বাংলা हिन्दी
 Čeština
 Українська
 Română

GBP/USD is consolidating the price action above the 1.2100 handle in the short-term, as the pair is looking to gather momentum in order to follow the bearish bias. If the Cable manages to break below 1.2123, then it can test the 1.2000 level as the next key area. MACD indicator is entering the neutral territory, favoring for more sideways.
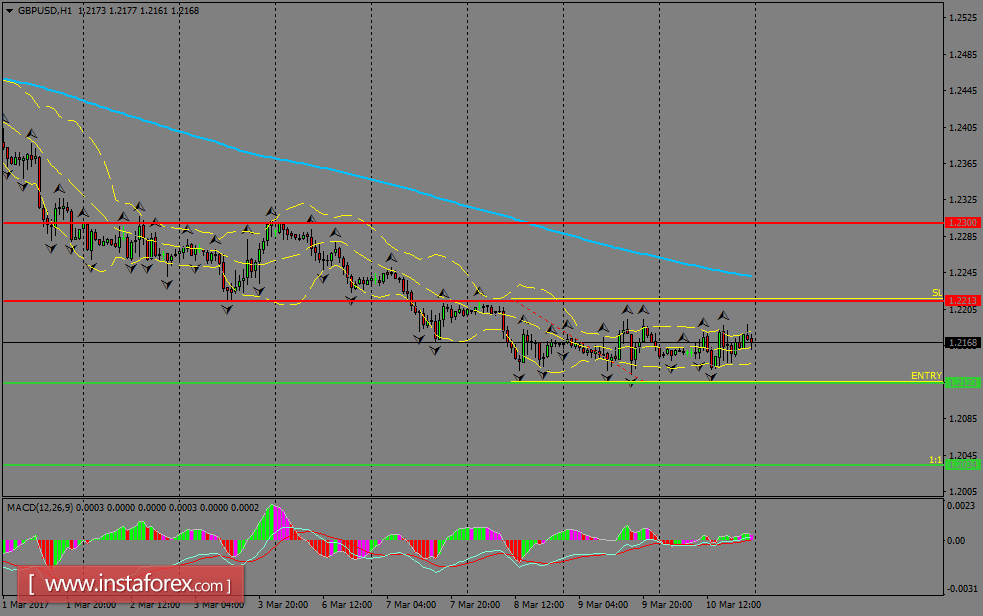
H1 chart's resistance levels: 1.2213 / 1.2300
H1 chart's support levels: 1.2123 / 1.2034
Trading recommendations for today: Based on the H1 chart, sell (short) orders only if the GBP/USD pair breaks a bearish candlestick; the support level is at 1.2123, take profit is at 1.2034 and stop loss is at 1.2216.