 English
  Русский
 Bahasa Indonesia
 Bahasa Malay
 ไทย
ไทย Español
 Deutsch
 Български
 Français
 Tiếng Việt
 中文
中文 বাংলা
বাংলা हिन्दी
 Čeština
 Українська
 Română

USDX continues to find support around 101.39, while it's trying to consolidate below the 200 SMA at H1 chart. If the index does a rebound at the current stage, it can test the 102.39 level and such move could possibly strengthen the bullish bias in the short-term. However, if USDX plummets below 101.39, it can reach the 100.44 level.
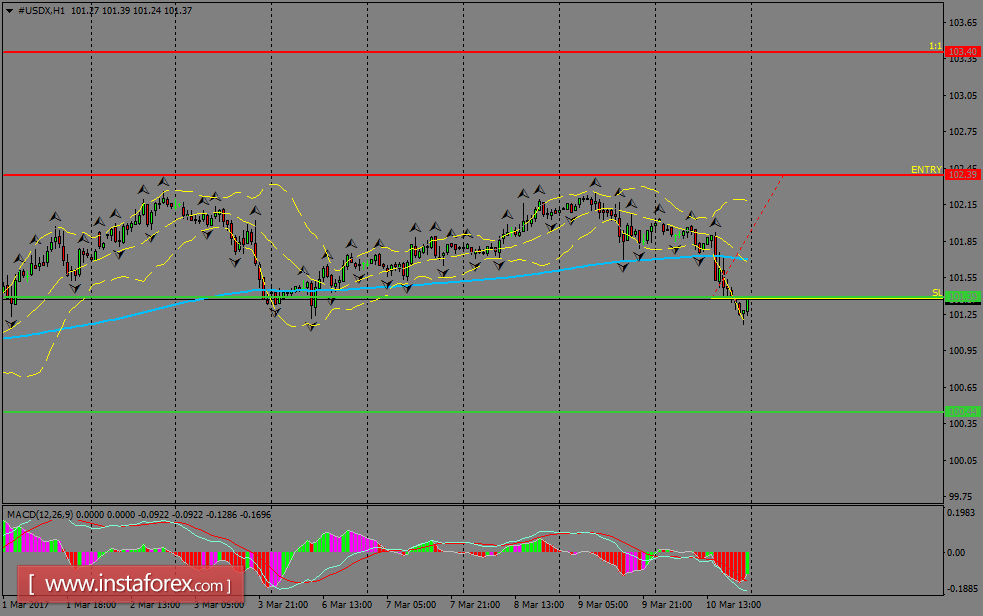
H1 chart's resistance levels: 102.39 / 103.40
H1 chart's support levels: 101.39 / 100.44
Trading recommendations for today: Based on the H1 chart, place buy (long) orders only if the USD Index breaks with a bullish candlestick; the resistance level is at 102.39, take profit is at 103.40 and stop loss is at 101.35.