 English
  Русский
 Bahasa Indonesia
 Bahasa Malay
 ไทย
ไทย Español
 Deutsch
 Български
 Français
 Tiếng Việt
 中文
中文 বাংলা
বাংলা हिन्दी
 Čeština
 Українська
 Română

The pair found dynamic resistance around the 200 SMA at H1 chart, as the bulls were capped by the 1.2213 level as well. Currently, it's possible to see another lower extension towards 1.2123. If the Cable manages to break below that zone, it can plummet to test the 1.2034 level. MACD indicator is entering the negative territory, favoring the bearish bias.
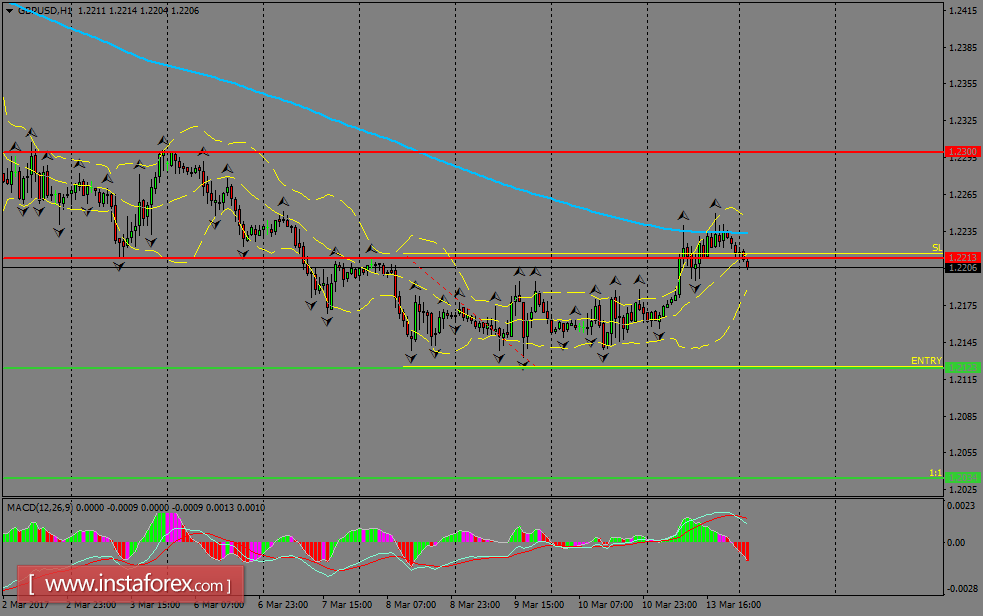
H1 chart's resistance levels: 1.2213 / 1.2300
H1 chart's support levels: 1.2123 / 1.2034
Trading recommendations for today: Based on the H1 chart, sell (short) orders only if the GBP/USD pair breaks a bearish candlestick; the support level is at 1.2123, take profit is at 1.2034 and stop loss is at 1.2216.