English
  Русский
 Bahasa Indonesia
 Bahasa Malay
 ไทย
ไทย Español
 Deutsch
 Български
 Français
 Tiếng Việt
 中文
中文 বাংলা
বাংলা हिन्दी
 Čeština
 Українська
 Română

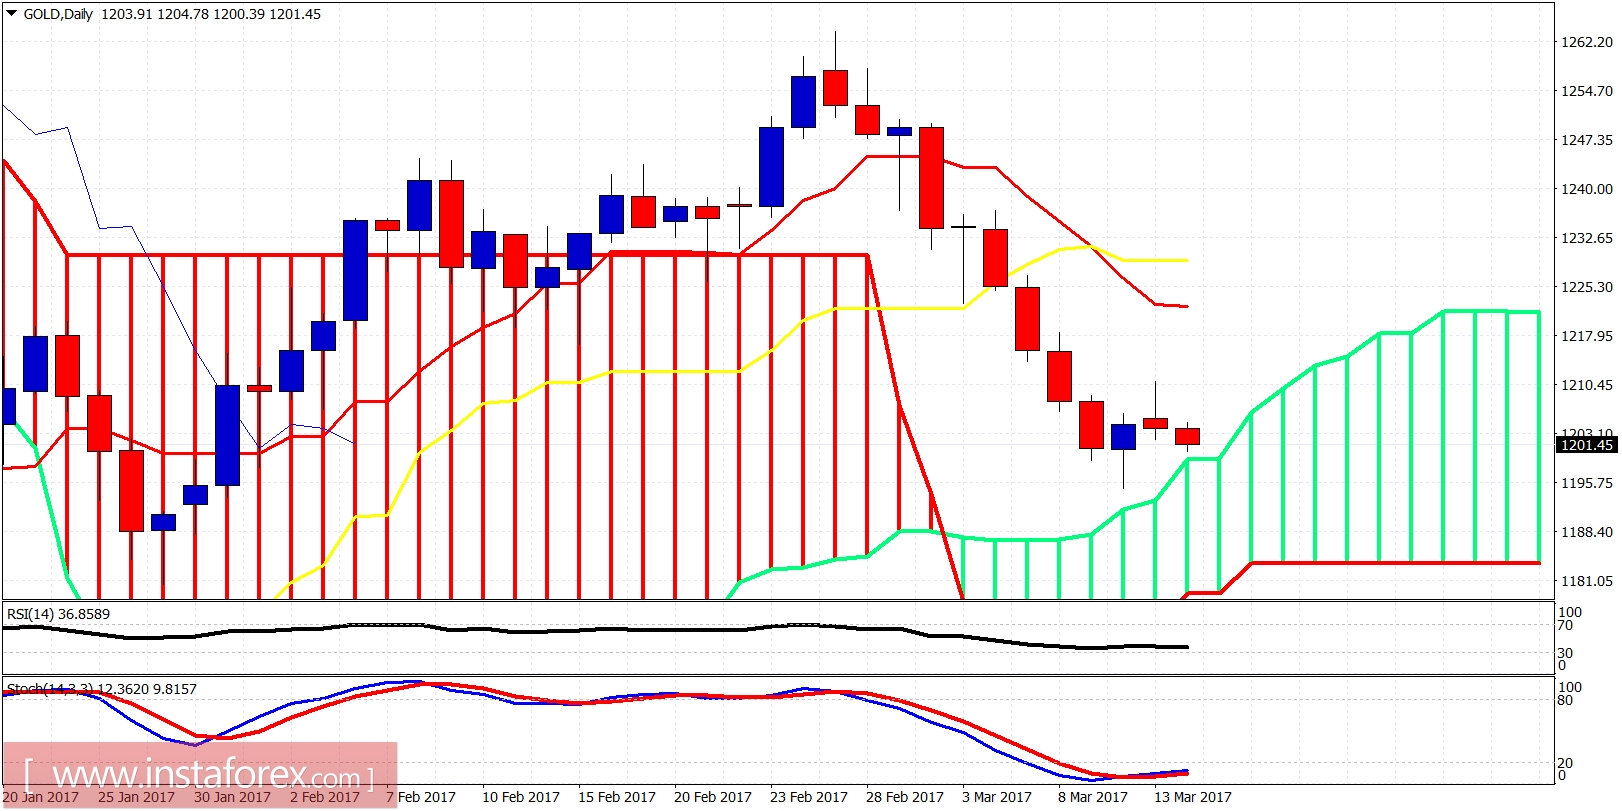
Gold price bounced yesterday towards the first important short-term resistance at $1,211 but got rejected. Price remains above $1,200 and is expected today to reverse upwards and eventually break above $1,211. Not necessarily today but I believe an important low is already in.
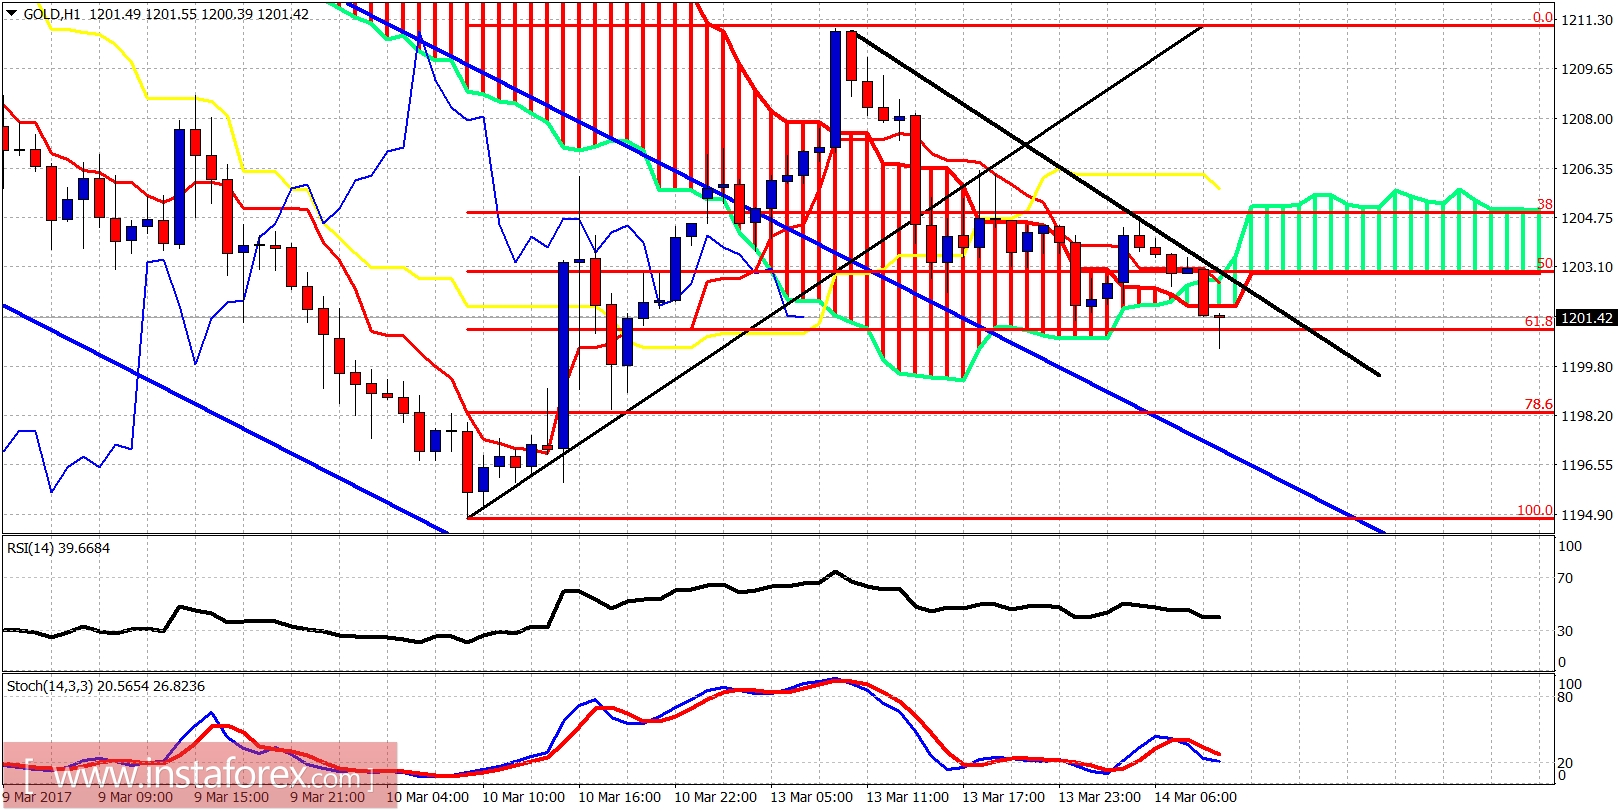
Black line - resistance
Gold price has stopped the decline at the 61.8% Fibonacci retracement. Price must break above resistance trend line at $1,204 in order to resume the up trend. Next short-term resistance is at $1,206. If broken the chances of a higher high above $1,211 are increased. Support is at $1,198.