 English
  Русский
 Bahasa Indonesia
 Bahasa Malay
 ไทย
ไทย Español
 Deutsch
 Български
 Français
 Tiếng Việt
 中文
中文 বাংলা
বাংলা हिन्दी
 Čeština
 Українська
 Română

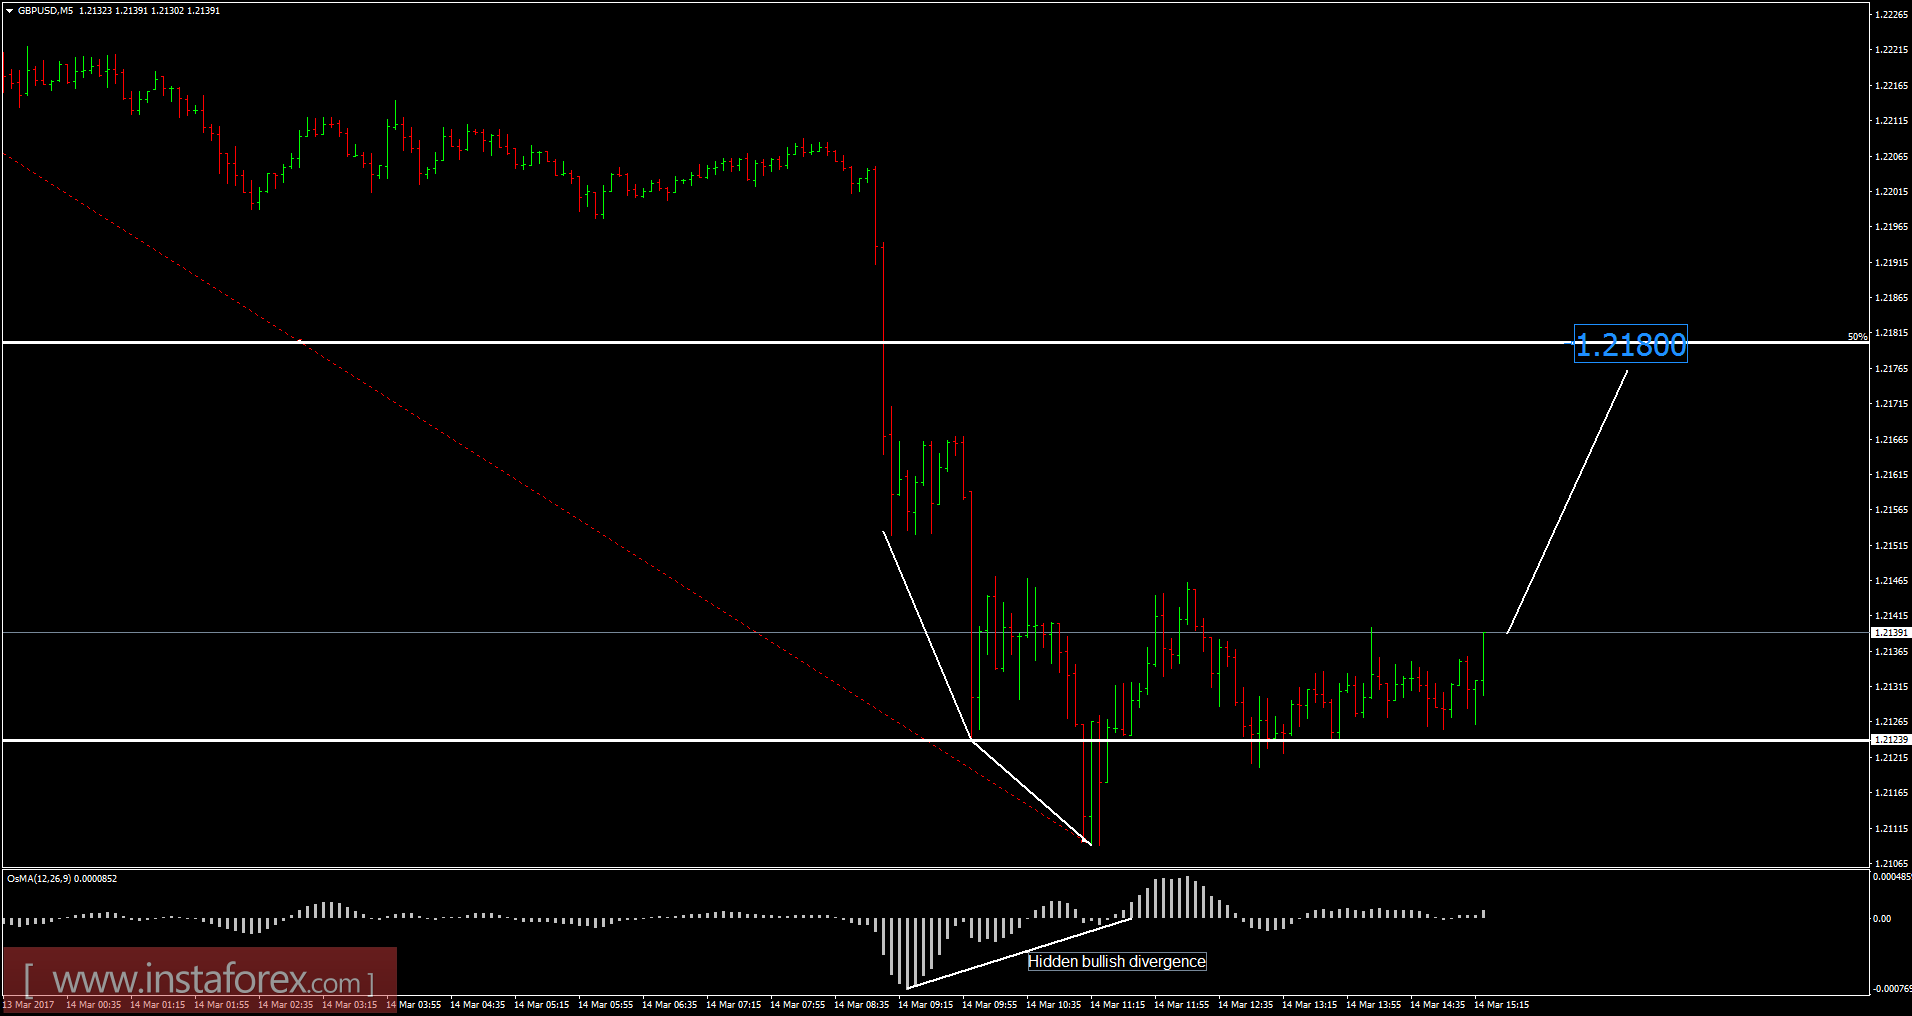
Recently, the GBP/USD pair has been trading downwards. The price tested the level 1.2109. According to the 5M time frame, I found hidden bullish divergence on the moving average osiclator and weak supply, which is sign that selling looks risky. My advice is to watch for potential intraday buying opportunities. Targets are set at the price of 1.2180 and 1.2200.
Resistance levels:
R1: 1.2245
R2: 1.2270
R3: 1.2310
Support levels:
S1: 1.2165
S2: 1.2140
S3: 1.2100
Trading recommendations for today: watch for potential intraday buying opportunities.