English
  Русский
 Bahasa Indonesia
 Bahasa Malay
 ไทย
ไทย Español
 Deutsch
 Български
 Français
 Tiếng Việt
 中文
中文 বাংলা
বাংলা हिन्दी
 Čeština
 Українська
 Română

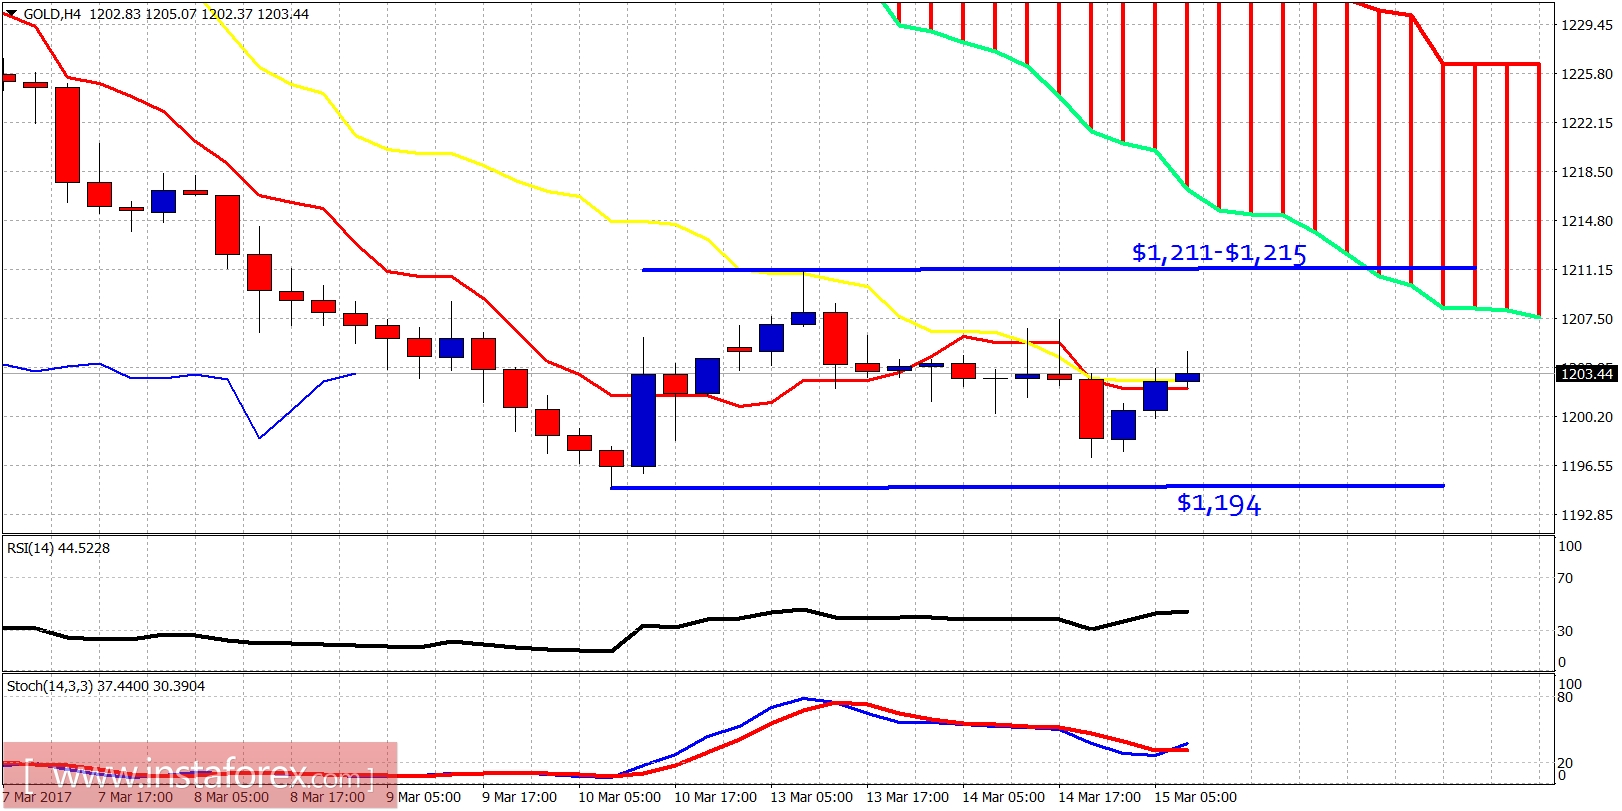
Gold is trading sideways between $1,211 and $1,194. Price has exited the bearish channel but has not made any meaningful progress to the upside. Price is expected to have increased volatility today after the conclusion of the FOMC.
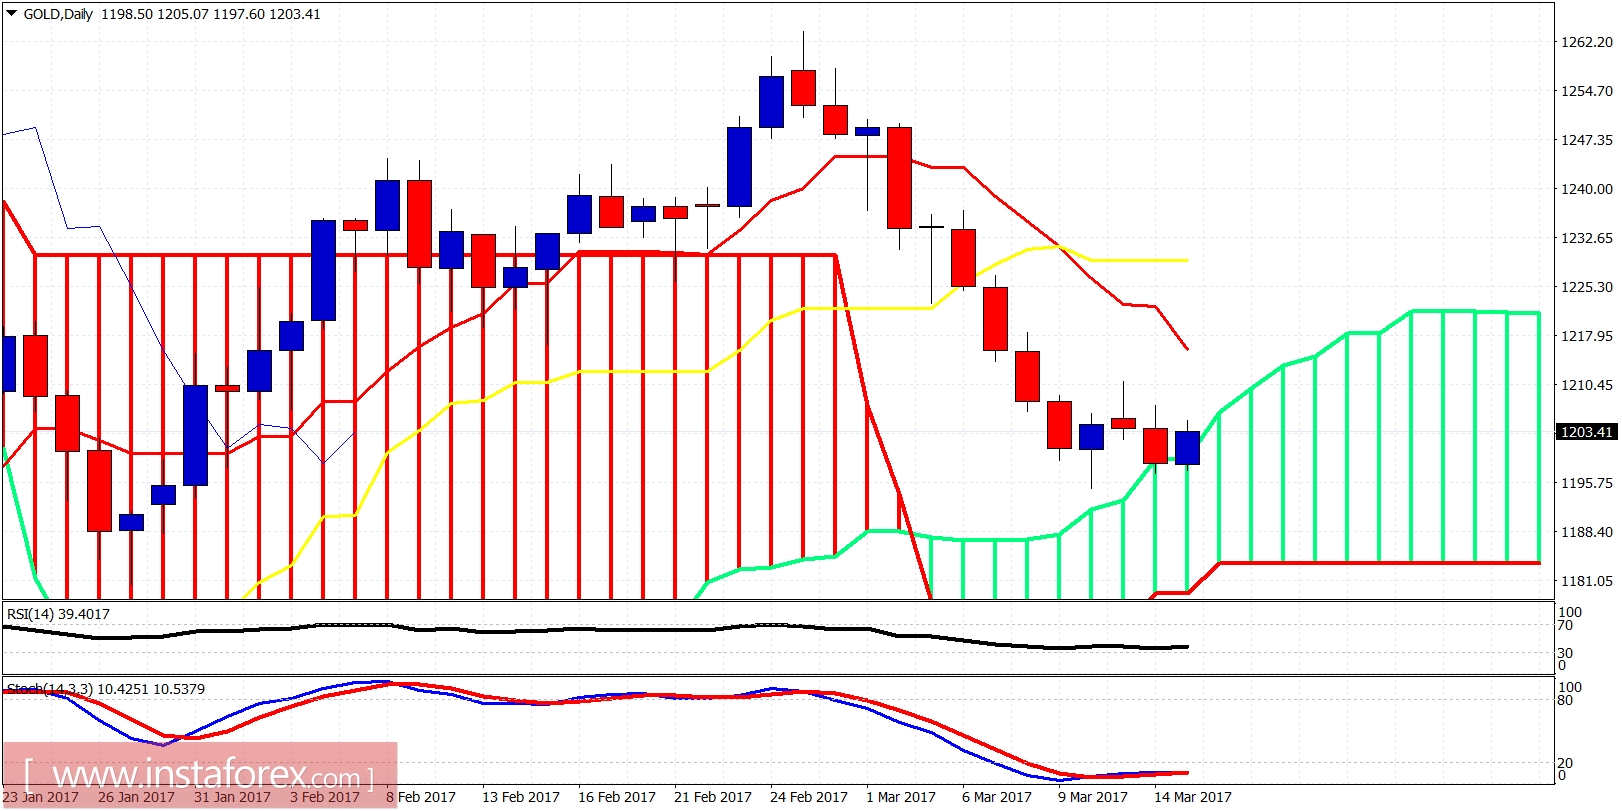
Gold price continues to trade below the Ichimoku cloud. In Ichimoku terms, trend remains bearish. However, Gold price has reached the $1,200 after rising to $1,263, and this correction could very well be over. Gold is now just waiting for the FOMC meeting tonight as a catalyst for a spike higher and reversal its short-term trend. Bulls need to break above $1,230-40 for a trend change. Bears need to break below $1,190 and remain below it.